


8 Research Proposal Examples & Template to Use


Written by:
Kevin Payne

So you have a startup and you need financing. For good reason: more than 90% of startups around the world go out of business within their first three years – all because of bankruptcy.
Thinking about your funding as early as possible can keep your business from taking a turn for the worst, so one of the best things to focus on in the early stages is how to get enough funds to power operations and generate enough revenue to keep things afloat.
At this point, you might have already considered all the things you need to prepare to deliver an effective startup pitch.
And in this post, we’re going to zoom in on one particular element that you won’t want to ignore when preparing your startup pitch: data visualization.
For any startup, especially those about to do their first seed funding campaign, one of the biggest challenges is actually finding options for said funding.
According to a National Small Business Association report in 2017, only some 15% of small businesses are successful in getting loans from large banks.
Others have found luck with other financiers and lenders who give out fast and efficient business loans that involve less paperwork and wait times.
And yet others still end up using their own personal funds.

Couple that with high competition to get the attention and interest of venture capitalist (VC) firms or angel investors, and you have a whole mountain that could scare off any entrepreneur.
The solution to this challenge? Once you find interested parties, it’s time to convince them that your startup is worth their money.
And because the key to an effective startup pitch is a mix of both great storytelling and rich data, you’ll want to focus on data visualization to up your chances of getting your startup funded.
Here are 5 great reasons why turning your data into clear, compelling images – be it charts or graphs or diagrams – can boost your chances of getting funded.
For one thing, data visualization can help you narrate your business’ story in more compelling ways.
By mapping out ideas and numbers in a more visually appealing way, you not only present the what of your data – you can also help people understand the why.
For your startup, this might mean using graphs and charts to illustrate the market needs, rooting it in the why behind your business’s beginnings or helping your audience see patterns and insights you’ve unlocked from loads of data.

Image suggestion: column with wall of text on left vs charts and graphs on right
You have about 8 seconds or less to capture someone’s attention – are you going to do it with a paragraph of text and numbers, or can you present your data in a way that’s simpler and easier to digest?
When you’re making a pitch to ask people for funding, you can expect that you’ll have to give them data in all shapes and sizes to convince them you’re worth it.
Data visualization makes all these complex concepts and findings easier to understand – consider how much easier it is to read a beautifully-executed graph instead of a page of text talking about the same thing.
In the mind of your potential investors, they want to know: how much money does this startup expect to make, and how much will I get from it over time?
You can present your projections over time visually, so instead of using a simple spreadsheet with text and numbers, think of how much better it would be to use a chart that lets prospects clearly see expected business growth over time.

You’ll also be able to answer prospects’ questions about where their money will be going in your business. You can use pie charts and other visuals to illustrate pieces representing areas that will receive the most or least allocation.

You can also present your prospects with some of the trends you’re anticipating that’s relevant in your industry.
This kind of data can strengthen your startup’s promise, so you’ll want to present these trends in appealing ways that get your prospects excited about said trends and where your startup comes in.
The main challenge lies in identifying these actual trends. But once you have these, you can use data visualizations to illustrate your market’s changing preferences, needs and behaviors.
If you’re ready to create a great business proposal, we’ve got a few additional tips you’ll want to remember below.
When you know why you’re creating this pitch or why you’re presenting this data, it’s easier to create a cohesive presentation that flows from one idea to the next.
In this case, your objective is to convince prospects about the idea that funding your startup will benefit them, so stick to data points that are relevant to them – include everything from your revenue projects down to employee hiring and resource allocation.
You’ll also want to keep this in mind when creating your visuals based on your existing data. Use the right kind of visual aid when presenting specific data. After all, the right visual with the right message in the right context can pack a powerful punch.
In their long-standing piece written for Harvard Business Review, Gary Williams and Robert Miller talk about the 5 types of decision makers they’ve noticed after years of working with different companies across every industry, as well as how to influence them when making your pitch.
Not only is their framework helpful in and of itself, it also emphasizes one important thing: you need to know who you’re pitching to if you want to win their support.
This might mean doing a bit of research about the players you intend to approach for funding, but it will be well worth the preparation.
As with anything, not all tools are created equal.
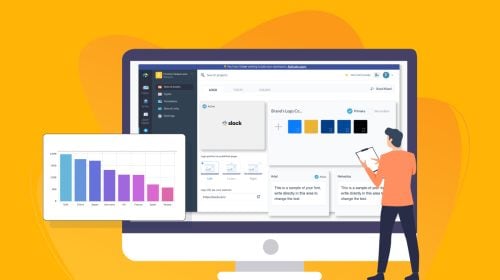
You’ll want to use reliable tools that help you communicate your story and message, complete from your data-gathering tools down to your presentation design tools.
You can create all your data visualizations and presentations straight from Visme, designing beautiful slides, charts and other graphics in seconds.
Last but not least, rehearsing your presentation can go a long way in making you appear professional and prepared. This also gives you the chance to review your visuals and the content they represent, so you can see just what data your presentation audience might really be after.
All in all, keep practicing and keep pitching. This is truly where you get your feet wet, get to know what prospects are looking for in your startup, and how you can keep improving your presentation until you keep closing those financing deals.

Trying to get funding for any startup always comes with its own challenges.
While you can’t control everything about how your pitch meeting goes, there are still things you can control to seem more professional and credible to your audience – one of these things being the data you present in your slides and how you present this data in your overall story.
Design visual brand experiences for your business whether you are a seasoned designer or a total novice.
Try Visme for free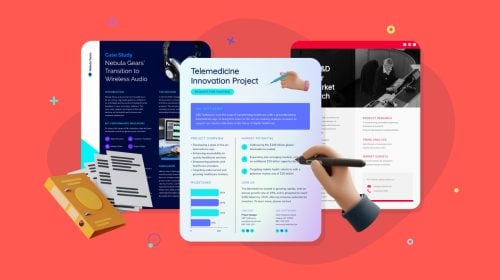

About the Author
Kevin Payne is a content marketing consultant who helps software companies build marketing funnels and implement content marketing campaigns to increase their inbound leads.