
Abstract
The passive house concept specifically improves insulation of exterior building components, utilisation of passive solar gains, airtightness and heat recovery from ventilation air. Reducing also heat losses from thermal bridges, the energy balance is improved significantly resulting in net heating demands lower than 15 kWh/(m2a) which is less than one-tenth of the typical heating energy in the average of existing buildings. The design concept can be used for every new building, and many thousand examples have so far been built for different use, in several climates and based on different construction type (e.g. concrete, timber, mixed). The very first prototype is a terraced house with four dwellings built 1990/1991 in Darmstadt. This building uses typical masonry external walls, concrete floors and a timber roof and can be seen as a representative example for highly energy-efficient construction. By monitoring all relevant energy flows through the building’s envelope during a period of more than 25 years, it has been confirmed that the energy consumption is as extraordinarily low as designed and stable over the whole period. This article especially investigates how this has affected the indoor climate, the indoor air quality and the durability of all components. By thorough investigation, an assessment of the maintenance cycles is given, which are representative for this construction type. The main characteristics of the components and the ventilation system after 25 years of performance of the pilot building have been determined; these are typical for passive house quality components; therefore, the results are indicative for the concept. The passive house concept turns out to be not only energy-saving but also most notably very durable and extraordinarily low-maintenance.
Passive house: exploring the limits to energy efficiency in buildings
The development of passive houses started with a research project looking for the improvement limits of energy efficiency in buildings: A 11-zonal dynamic Beuken-model including heat flows in two dimensions, thermal radiation models for each zone, glazing models including temperature dependent convective and radiative heat transfer and multizonal airflow was set up (Feist 1993) and later validated (Feist 1994). During five development projects, solutions for thermal bridge-free construction (Feist 1988/1992), improved window insulation, airtight structures, efficient air-to-air heat recovery systems and indoor air quality-based ventilation control were developed.
The results of these developments were used within the design of the first occupied passive demonstration building, a three-storey, four-unit terrace house by architects Prof. Bott/Ridder/Westermeyer (Bott 2014). The four units were built 1990/1991 and completed in October 1991 before four families moved in (Fig. 1); there are now 27 years of user experience and monitoring protocols. The research documented here looks into the service life of all systems.

First regularly occupied passive house; row of four dwellings designed by architects Bott/Ridder/Westermeyer placed in Darmstadt Kranichstein/Germany/cool temperate climate (after Troll and Pfaffen 1964) (photo: authors)
Monitoring was performed using calibrated platinum resistor temperature sensors (“Pt100” ± 0.15 K), pyranometers, a pyrgeometer (horizontally), hygrometers, heat flow sensors, heat metres and electricity metres with intervals of 15 min. A total number of some 200 sensors were logged over a period of 5 years. During the winter 1992/1993, occupancy patterns were also monitored (including monitoring of on/off times of all relevant internal heat loads from appliances and user presence). The 11-zonal thermal network-model was run with the measured external air temperature, radiation data and the monitored internal load data (including heat from radiators) as boundary conditions. The geometric and material data of the model were chosen from the construction plan, and standard values of the thermal conductivity and specific thermal capacity of the building materials were used (these values were not varied to fit the measured results; but in a sensitivity analysis published in Feist (1997b), the influence of varying material properties was discussed). Initial conditions are difficult to measure; so, the model was run from 1 to 31 Dec 1992 to prime accurate initial conditions starting from Jan 1, 1993. A typical example of comparison of measured data (symbols) and simulation (lines) is given in Fig. 2 showing a section through the west-facing external wall with five embedded Pt100-sensors and the indoor air temperature in the adjacent room. For the sensors within the thermal envelope, the differences between simulation results and measurements are barely visible; these are within ± 0.2 K. The deviation on the external surface beginning at 9 pm on February 1, 1993, is due to angle inhomogeneity of long wave atmospheric radiation (partially clouded sky)—the pyrgeometer can only measure the horizontal radiation balance. This deviation has an influence on the temperature in the centre of the insulation but no important influence on the temperatures and heat flows nearer to the room side surface. In Feist (1997b), the conclusions were as follows:
-
Measurements in the building and simulation results of temperature profiles coincide within 0.2 K and are within the accuracy of the sensors.
-
The thermal simulation model based on Fourier’s equation, temperature dependent convective film coefficients and a radiation model give reliable results using the known geometry and the standard material properties (without fitting parametres).
-
The buildings perform within the measurement accuracy, reproducing the extraordinarily low heat flows from the preliminary simulation done for the design.

Comparison of monitoring data (symbols) with whole building thermal simulation (lines); example west-facing external wall in the third floor and indoor temperatures in the adjacent room (diagram: authors)
Monitored energy consumption of a 25-year time span
Figure 3 shows that the heating energy consumption has remained stable at an average of 8.4 kWh/(m2a); this is measured final energy (natural gas) used in the central heating system for all four dwellings in the row, thus including all losses of the space heating system (losses of the furnace and also all distribution losses). This is even less than calculated by the preceding simulation and the design value of 11 kWh/(m2a) (PHPP 2016). For comparison, average heating energy consumption in comparable German dwellings in 2016 was reported to be 138 kWh/(m2a) (Techem 2017); the actual 2016 German ordinance for new buildings of this type requires still just some 60 kWh/(m2a). The monitored final energy consumption for heating in the pilot project is thus 14% of the average consumption of new buildings in the same category. The diagram shows variations with different winter weather conditions but no long-term trend: The overall efficiency of the building is thus not deteriorating, nor are there palpable changes in user behaviour.

Monitoring results of final energy consumption for heating; natural gas metering for the total of all four dwelling units; heating and domestic hot water (dhw) discriminated by heat metres; reference: German ordinance 2016; data from (Feist et al. 2016b)
After 25 years, the time had come to put the components and their overall function to the acid test. The results of this test are to be documented in this paper.
Passive house components of the building envelope
The passive house concept is based on five consistently pursued improvements to the building envelope and building service systems (Table 1).
Building fabric I: roof structure
The building code required green roofs in the area. The grass roof rests upon chipboard supported by I-beams (Fig. 4). The axial distance between the beams is 1.08 m. With an insulation thickness of 445 mm, using blown-in mineral wool, the roof has a U value below 0.1 W/(m2K).

Non-ventilated roof in the Darmstadt Kranichstein Passive House; the support structure consists of Nordex I-beams; interior: polyethylene (PE) film as vapour retarder, gypsum plasterboard; exterior: 50-mm chipboards, root barrier, green roof structure (original construction drawing, arch. Ridder)
If a non-ventilated roof is used, the design must ensure that moisture does not build up. Here, PE film on the interior fulfils this purpose. The airtight connections to exterior walls are particularly important here (see below). The moisture profile has reached a steady state over the past decades. This was
-
determined in long-term measurements of the humidity,
-
compared to a hygrothermal simulation for the structure (DELPHIN, (Grunewald 1997)) and
-
confirmed by testing a sample of the insulation, with a gravimetric determination of moisture in the laboratory.
In Feist et al. (2016a), the results are presented in detail; measurements continue to be taken. Within measurement tolerance, the roof structure performs as expected from the hygrothermal simulation;
-
the moisture steady state is only reached after 15 to 20 years;
-
there was no moisture build-up in the measurements nor in the simulations anywhere in the structure including also at the most critical point (directly beneath the chipboard), the maximal value (in January) was 13.7 mass percent—up to 18% would still be acceptable here (DIN 68800-2 #11.2 2012).
Although the orientation is suboptimal (northern roof!) and despite long periods with humidity of nearly 100% in the substrate of the green roof, the structure reveals no damage after 27 years. To add to the security, in a new construction, more drying reserve will come from a moisture-adaptive vapour retarder and/or from capillary-active blown-in insulation (e.g. cellulose). With all solutions, airtightness is key to preventing damage to the structure; likewise, a minimum slope must be ensured—standing puddles of water will damage any structure. The insulation thickness used is irrelevant for the moisture issue.
In conclusion, highly insulated roof structures are possible as timber roofs even under a green roof if airtightness is ensured and precipitation drains off at the outside. Several alternatives are possible, though the authors now recommend a ventilated cover (such as a tensioned membrane or composite wood board or windproof timbered formwork, see, e.g. Hazucha (2016)). In the case presented here, the non-ventilated roof structure also worked well. There are practically no limits to the durability of such a highly insulated structure.
Building fabric II: exterior wall structure
The exterior wall is a 175-mm (façades to south/north) and 240-mm (others) lime sandstone wall; gypsum plaster is on the inside, and two layers of insulation are on the outside (150 mm + 125 mm EPS) to produce an exterior insulation finishing system (EIFS); the exterior plaster is mineral plaster that has not been painted anew in 27 years. The U value of this exterior wall was 0.137 W/(m2K) when new.
A visual inspection of the façade shows that the exterior surface is intact everywhere, though it has turned grey and has been stained (vandalism) in spots. An expert assessment found that the exterior plaster does not currently need to be renewed; a new coating, with a diffusion-open, waterproof silicate paint, is possible for aesthetic reasons, but not yet necessary.
There is widespread consensus among experts that a masonry wall made of lime sandstone with interior plaster can remain in use unchanged for centuries; these subcomponents therefore do not need to be tested. In contrast, there is a widespread opinion that service life for EIFS is short—although literature shows it can also be very long. For further clarification, a sample was cut out of the EIFS at the pilot building on Feb 24, 2016 (Fig. 5). The sample was sent to the laboratory of University of Innsbruck’s Institute for Construction and Material Sciences (Prof. Dr. Andreas Saxer), where it was further broken down to investigate:
-
the insulation material’s raw density; result: 14.92 (± 0.17) kg/m3 (like new),
-
materials’ structural load capacity; s10 59 kPa; (like new)
-
the EPS’s thermal conductivity, result: 0.0412 (± 0.0012) W/(mK) (like new),
-
moisture content: less than 0.5 mass percent everywhere (exceptionally dry).

Sample of insulation and plaster from the western wall’s EIFS at the passive house (the weather-exposed wall); the plaster is solid throughout just like a concrete slab (>15 mm); the characteristic values for the materials are as good as when they were new. This structure will serve for another 25 years without maintenance. (Photo: Ebel)
The assessment of the sample taken of the exterior mineral plaster is especially interesting. There are no indications of fissures or any imperfect adhesion of the plaster on the insulation layer.
Conclusion: Highly insulated wall structures can be built in masonry construction with a lot of wall materials; these are inexpensive with EIFS. The systems remain effective, dry and weatherproof using an exterior mineral plaster reinforced with a fibreglass tissue. Such plaster can be expected to remain in use for more than 50 years even in areas with harsh climatic conditions; the insulation layers are robust for even longer. Today, EPS, XPS, PUR/PIR, mineral wool, resol and wood fibre insulation materials can be used.
Building fabric III: avoiding thermal bridges
The entire envelope is free of thermal bridges; the specific solutions used are documented in Feist (1997a). All connections have again been investigated after 25 years, e.g. the connection between the blown-in insulation material in the roof and the exterior wall in the ridge. Figure 6 shows a thermographic view of this connection in the guest room of the outer terrace house: The geometric effect of the two-dimensional heat flow leads to a slightly lower temperature (0.7 K) (exterior temperature 4 °C (Fig. 7), operative indoor temperature 21.7 °C). This level corresponds with the numerical calculation; there is no indication of increased heat losses after 25 years of use.

Interior thermography for the connection between the exterior wall and the roof (Jan 1, 2016): The temperatures of the regular surfaces (21.3 °C) hardly differ from the average operative temperature in the room. At the geometric thermal bridge of the connection between the roof/wall (ridge), the temperatures do not drop below 20.6 °C. A slight temperature reduction also at the places of the counter slats can be seen looking attentively at the IR image of the ceiling. (IR image: authors)

External thermography of the eastern wall at the Kranichstein House (Jan 1, 2016): The temperatures of the surfaces are around 4.2 °C, which is hardly more than the average outdoor temperatures of nearby objects (scrub 4.0 °C). No significant temperature differences are detectable throughout the exterior surface, but the exhaust air outlet and the window upstairs are clearly visible. Note: The radiation temperature of the (cloudy) sky was around 2.3 °C. (IR image: authors)
Conclusion: Thermal bridge-free connections can be successfully planned and implemented in all construction types. The solutions used here have not changed within 27 years; there still are no relevant thermal bridges. Today, certified construction systems avoiding thermal bridging are available for all construction types and architecture types (Weber 2016 and Hazucha 2016).
Building fabric IV: airtightness
An airtightness test was repeated after 25 years on February 12, 2016 (Feist et al. 2016b). The findings reveal that only the window lip seals have lost elasticity over the years (the initial n50 value increased to 0.26 (3) h−1). When these were renewed (in line with normal maintenance cycle), the originally documented airtightness of 0.21 (3) h−1 was once again attained. All of the critical connection points, especially the connection in the roof (PE film) to the masonry exterior wall (interior plaster), proved to be absolutely airtight (leak detection campaign with constant negative pressure in the building) (Fig. 8).

In 1991, the roof and the wall structures were connected by overlapping PE film (a), plastered over with interior plaster (central image b). This connection retains its perfect airtightness even under heavy loads (thermal and hygric expansion, earthquakes). After 25 years, the unavoidable tear in the surface (wallpaper) is visible, but the underlying film connection remains airtight (c) (all photos and IR image: authors)
Conclusion: Keeping exterior building envelopes airtight for the long term is mainly a question of correct design. Good connections between the airtight layers at the edges between building components are crucial. Here, a number of standard solutions are available that are easy to implement, such as caulking (with an anti-adhesion strip (round cord) to avoid adhesion on three sides) or an adhesive tape covered with plaster. These approaches were pursued in the pilot project, and it proved to be sufficiently airtight after 25 years.
Building fabric V: passive house windows with positive energy balance
A modern passive house window has four characteristics: (1) highly efficient glazing (here, low e triple glazing filled with Argon or Krypton); (2) a thermally separated edge seal; (3) a window frame with improved insulation; (4) thermal bridge-free and airtight installation.
Triple glazing
The glazing used in Kranichstein was a custom-made product with three panes of 4-mm float glass, low e coating on surfaces 3 and 5, with two 8-mm spaces filled with Krypton. The low e coatings available in 1990 had an emissivity value of ε ~ 0.1. At an (assumed) 95% krypton initial filling degree, the original U value of the glazing was 0.75 (± 0.03) W/(m2K).
The investigations at the pilot project provide clear answers to the service life period question:
-
(1)
A mobile heat-flow measurement device was developed for the valuation of U values. The device consists of an interior and an exterior part with identical dimensions. Glass covers ensure that the radiative characteristics of the surfaces correspond to the surface of the glazing unit being tested. The interior part contains the heat flux sensor, secured at the sides by an additional edge cover. Foam rubber is placed on the glazing unit’s surfaces during testing to prevent convective heat transference. The temperatures of the respective surfaces of the glazing unit during testing are measured by platinum resistance thermometers made of thin wire laminated in foil and located in the geometric centre of the measurement device. The characteristics of the temperature sensors were established beforehand in joint calibration procedures.
The exterior unit was shielded from solar radiation by venetian blinds in combination with a dedicated radiation screen made of XPS insulation board and highly reflective foil (space blanket). Data was recorded as 1-min mean values, based on 1 s−1 measurements over several days in the wintertime when a sufficient temperature gradient was present. To exclude any disturbance by solar radiation, only values between 22:00 and 07:00 were later analysed. The estimated measuring uncertainty for the resultant glazing U value is ± 0.05 W/(m2K). (Details see Feist et al. (2016a)) (Figs. 9 and 10).

Schematic of the in situ U value measurement device, not to scale (graphic: authors)

The measurement device is held in place by suction cups and a lever cascade for uniform pressure. On the exterior side, the blinds and radiation screen are visible (photo: authors)
After 25 years, the glazing U values were found to be 0.78 (5) W/(m2K) for five of the panes investigated; another came in at 0.97 W/(m2K). The gas losses in most of the glazings can thus be quantified to be below 0.2 (± 0.1)%/a. For one of the panes, it is unclear whether it had already contained only 65% Krypton in the beginning; otherwise, the gas loss would be 1.2 (2)%/a. Conclusion: At below 0.25%/a, gas losses are generally very low; in a fraction (15%), rates of some 1%/a can occur, but even then the functional service life of triple glazing is estimated to be above 40 years. Sensitivity to gas losses drops considerably if Argon is used instead and the distance between panes is increased to 2 × 15 mm. Along with the better coatings available today, the Ug value will be improved to below 0.60 W/(m2K). To take account for gas losses, the nominal U value of the glazing should be calculated for a filling degree of 85%, though initially 95% should be required during gas filling.
-
(2)
In the first year (1992), a number of cracks occurred in the panes resulting from thermal expansion (six cases); thereafter, the industry began applying low e coatings to layers 2 and 5 to reduce absorption in the centre pane. Since these issues were resolved (Feist and Holtmann 1998), cracks in window panes have only occurred in exceptional cases, such as during improper storage or transportation.
-
(3)
The “pumping phenomenon” continues to be a debated topic. There is a consensus that small spaces (like in Kranichstein (2 × 8 mm)) should not cause a problem, and indeed none have occurred. The latest developments for edge seals reduce the pumping effect by compensating volume of the thermally expanding filling gas.
-
(4)
Around 2012/2013, industry in Germany began automatized production of triple glazing, bringing the price difference to double glazing down to less than 25 €/m2 (retail price). Such glazing saves more than 3 €/(m2a) in heating costs and has a life span of at least 35 years (see above). Triple glazing is therefore the most economic choice and dominant on the market for both new builds and retrofits in Germany today.
Mitigation of spacer thermal bridge
A thermally separated spacer was not available for the windows in the pilot project: Only aluminium spacers were on the market in 1990. In Feist (1993), the benefits of reducing edge losses with the use of stainless steel or plastic spacers were calculated for the first time. Now, dozens of thermally separated spacers have been certified. In Kranichstein, another solution had to be implemented: The window frame’s insulation was pulled a few centimetres over the glass, forcing heat flow to pass vertically through the only 4-mm glass pane—this kind of solution will be useful again with modern vacuum glazing.
Conclusion: The solution used in the first passive house building works and consistently prevents condensate from building up at the edge of the glass. Similar Ψg values are provided today by certified, thermally separated spacers, which increase the aperture.
Insulated window frames
Figure 11 shows the comparison of calculation results (2-D heat flow (EN 10077)) to measurements. Thanks to the insulation panels, the frames have an Uf value of 0.62 (2) W/(m2K). Concerns were voiced about encapsulating the timber within integral foam insulation on both sides, but hygrothermal simulation provided a clear answer: The additional insulation ensures a smooth increased temperature level and protects from precipitation, keeping humidity very low.

Temperature profile for the interior window’s surface; bold: thermographic measurement (shown in a grey scale in the bottom-most thermal image excerpt); grey symbols: 2D heat flow calculation, result: Ψg = 0.03 W/(mK) (EN 10077) (graphic: authors)
Material moisture in the timber-frames was measured in regular intervals (Gann Hygromette resistance measurement) giving 9.2 mass percent, with a fluctuation of ± 1.2, close to the standard indoor equilibrium moisture content of timber.
Conclusion: Better insulation raises the interior surface temperature of window frames; thermal and humidity loads on the component are reduced. Moisture measurements in the pilot project after 25 years confirm this expectation; all substance is unchanged and dry throughout, so it can be expected to last at least another 25 years.
Thermal bridge-free and airtight installation of windows
For the first time, the windows in this project were completely attached in front of the masonry wall and thereby placed within the envelope’s insulation layer. In this way, the linear thermal bridge loss coefficient was reduced to below 5 · 10−3 W/(mK) (Fig. 12a). This installation method has generally proven worthwhile, shown e.g. in the IR image (Fig. 12b).

Thermal bridge-free window installation in 1991 (a cf. the frame bracket on the wall as a support) and b infrared image from 2016 (photo and IR image: authors)
The connection to the airtight layers of the building components is crucial: In Kranichstein, an end rail for the plaster meets the window frame; once an anti-adhesion strip (round cord) had been added to prevent adhesion on three sides, the gap was then filled with permanent elastic material (in this case, acrylic mass). Investigations of all windows reveal that this connection is still perfectly airtight after 25 years. These days, one work step could even be skipped by using a plaster end rail with an adhesive sealing profile (called an “Apu”-rail).
Balanced ventilation with heat recovery
Interior air quality: the top priority goal of ventilation
Mechanical ventilation ensures sufficient fresh air at all times. In a household of three persons, 3 × 30 m3/h is required, equivalent to 90 m3/h of outdoor air. The same amount of extract air has to be removed from the kitchen and bathrooms. The ventilation system in Kranichstein is described in detail in Feist et al. (2016b). Here, we will only discuss a few crucial aspects and the results of IAQ field tests. Figure 13 shows the CO2 concentration profile for the upper floor Jan to Feb 2016 as measured with a recalibrated Netatmo sensor (Wörner et al. 2015). The concentrations are largely within the IDA1 range (high indoor air quality). For the averages, however, only the occupancy times are taken into consideration, producing an average CO2 value of 850 ppm during occupancy (uncertainty of this value: 150 ppm). On February 12 and 13, 2016, airtightness test were conducted and the ventilation system was shut off. While windows were opened in intervals, the monitoring clearly shows that this was insufficient to ensure good air quality.

CO2 concentration and indoor humidity profiles in the third floor on the north side of the pilot project. Note the time when the ventilation system was not in operation on 12 and 13 Feb 2016, when pressurisation tests were conducted (all ducts were sealed, but windows were repeatedly opened for ventilation) (diagram: authors)
CO2 is an indicator of indoor air quality; on its own, it does not impact on health up to a concentration of 2500 ppm. Nonetheless, other indoor air contaminants generally correlate with CO2 concentrations. In the presented case, in addition to CO2, two measurement campaigns were conducted on February 20 and 21, 2016, to detect microorganisms. Furthermore, air samples were taken on February 23, 2016, to test for volatile organic compounds (VOCs) and formaldehyde. All results show very low indoor air concentrations (Feist et al. 2016b).
Three Radon Scout units (Sumesh et al. 2013) were used to determine the average radon activity during normal operating hours, yielding 43 (± 10) Bq/m3, a level that rose to 65 (± 10) Bq/m3 on the days when the ventilation system was switched off. Here, it becomes very clear that mechanical residential ventilation considerably improves IAQ.
The duct system: clean thanks to ePM1 80% particulate filters
The ventilation system used in Kranichstein has a filter box with a F8 comb filter at the external air inlet. These filters are standardised and produced in large quantities, making them relatively inexpensive (16 to 40 €). The large filter surface also keeps pressure losses low (at 106 m3/h: 9.7 (3) Pa). High-quality filters at the front end prevent dust from accumulating inside the ductwork. In particular, respirable fine particles from partly combusted hydrocarbons, rubber particles and soot remain in the filter, thereby considerably improving IAQ. Figure 14 shows a filter after 1 year of operation (left) and a new one (right). More than 80% of particulate components > 1 μm remain in this filter. Downstream duct systems therefore remain free of these particles, as the image of the air duct branching off from the filter box shows. On February 20 and 21, 2016, images were taken of the fresh air duct and sections of the supply air duct network after 25 years of operation (never been cleaned in the meantime) as described in the following section on the hygiene inspection. There were minimal traces of dust in a few spots. The method of using high-quality filters to keep ventilation systems clean has proven worthwhile in this project. For this reason, we recommend the use of F8 or F9 (ePM1 80%) filters in the outdoor air stream.

F8 filter from the pilot project, annual exchange, and view into the completely clean fresh air duct where it leaves the filter box (photos: authors)
Hygiene inspection of the ventilation system after 25 years of operation
The examination of the heat recovery ventilation system showed that, with the exception of wearing parts such as filters and fans, virtually no components had to be replaced. The longevity of the ducts (in this case galvanised spiral ducts) as well as of the ventilation unit including the heat exchanger could be proven beyond doubt. This longevity of the components raises the question of whether the hygiene over this long period could be maintained easily, especially since in this example, no cleaning of the channels occurred so far. Especially the hygiene and the question of the necessary cleaning intervals are one of the most frequent topics of discussion in the public. The following investigations and results can provide valuable insights. The extent and level of detail of the sampling allow conclusions to be drawn about the hygiene of the duct system as well as the indoor air quality.
Sampling and evaluation
The hygiene inspection, which was carried out in the western terraced house (February 20 to 21, 2016), examined the indoor air hygiene as well as the hygiene of the ventilation system. The sampling was carried out according to DIN ISO 16000-16 (2008) and DIN ISO 16000-17 (2008). Air samples were taken by means of air sampler MBASS30 (Hohlbach) in the interior as well as of the outside air on the north side of the building (suction side) for comparison purposes. With this sampling, the respective total germ density in the air (collection volume per 100 l at a flow rate of 30 l/min) was determined. The exact documentation of the incubation and evaluation of the malt extract bearing and DG18 agar plates can be found in the laboratory report no. A-2015/6127 (Kirchmair 2016, p.1). As a result, the respective colony-forming units (CFU/m3 air) were reported (Fig. 15).

Air sampler (impact collector MBASS30, Fa. Hohlbach, left); filtration sampler (Sartorius), automatically controlled vacuum blower (middle) and gelatin filter holder (right; photos: authors)
In order to be able to investigate the air hygiene of the air at the supply air outlets, 200 l of air was collected on gelatin filters by means of a filtration sampler (Sartorius MD8) and evaluated in the microbiological laboratory. From this, it was possible to deduce the colony-forming units per cubic metre of air.
In addition, a sampling in the supply air duct should be done at various points before and after the device. For this purpose, the method of isokinetic sampling was used, i.e. the suction speed in the inserted glass tubes corresponded exactly to the air velocity in the channel. The samples were then also applied to malt extract and DG18 nutrient media (Fig. 16).

Isokinetic sampling using filter holders (left), and glass sampling tubes (angled 90° in the flow direction) (right; photos: authors))
Moreover, the duct wall was examined with the help of selvedge samples (impression plates Merck ENVIROCHECK CONTACT TVC). This type of sampling was particularly well suited because the plates can be easily applied to the inner surface of the round channels (Fig. 17).

Swab samples with pads (Merck ENVIROCHECK CONTACT TVC, left), special camera for the inspection of ventilation ducts (Snakecam, right; photos: authors)
Results of the visual inspection of the supply air ducts
For the visual inspection, the system was opened on the supply air elements as well as on the outdoor air filter box and the central ventilation unit. Virtually, no impurities could be detected in the supply air duct network, the galvanised spiral duct and the walls of the filter boxes and internals were completely bare except for tiny dry dust deposits in areas of low flow velocity. The same results were found for the inspection of the supply air ducts with the help of the special illuminated camera (Snakecam). No significant dust accumulation and no corrosion could be detected (Fig. 18).

Photo documentation of the visual inspection at the air outlet (left, middle) and filter box (right; photos: authors)
This excellent cleanliness in the supply air duct network is due to the high filter quality of the exterior air filter and the regular filter change. Thus, the supply air duct system can obviously be kept clean for several decades without cleaning. Prerequisite for this is both the cleanliness of the channel sections during the construction phase (covering the open channel ends of the respective sections to commissioning) and a dense filter seat (correct sealing of the filter to the filter housing, so that air bypasses are avoided). If it is not possible to guarantee the cleanliness of the duct sections during the construction phase, the duct system must already be cleaned prior to commissioning, which would actually cause unnecessary costs. In general, filter replacement is cheaper than cleaning.
In the examined building, the exhaust air outlets in the baths were not protected with prefilters. Thus, some dust deposits on the pipe walls occurred by condensing grease vapours in the first metre section of the duct after the exhaust air outlet. In this installation, this section of the canal was made of cost-effective Aluflex pipe, which can easily be replaced. With the help of the built-in grease condensation filters made of stainless steel, the grease vapours from the kitchen exhaust air can also be condensed out. The stainless steel filters can be removed from the grease in the dishwasher at regular intervals and used again.
In general, although the investigation of the exhaust air duct network revealed clearly visible dust deposits, even after 26 years of continuous operation without purification, there was still no functional impairment. Hygienically, the dust deposits in the exhaust air are irrelevant, because they are led outside with the exhaust air—which runs permanently.
After the inspection, the exhaust air outlets were also retrofitted in the bathrooms with easy-to-install prefilters on the air outlets in order to keep the dust level even lower on the exhaust air side in the future. Again, stainless steel expanded metal filters are used, which can easily be cleaned regularly in the dishwasher. The recommended cycle for this is about half a year.
Air sampling (indoor and outdoor) and evaluation results
The evaluation of the room air samples according to fungus species and yeasts as well as bacteria was carried out on a total of six air samples (living room, children’s room, guest room, working room and outdoor air before and after the indoor air measurement). The detailed results about colony-forming units (CFU/m3 air) yeasts and fungi on malt extract agar (MEA) or DG18 nutrient medium as well as the results in relation to bacteria can be found in Kirchmair (2016, pp. 2–3). In summary, Kirchmair stated: “The germ densities of mould fungi were low in all interior samples and significantly lower than in the outdoor air samples. The germ spectrum was comparable.”
Air sampling at supply air outlet and isokinetic sampling in the supply air duct
Air sampling was performed at the air outlets in the living room as well as in the children’s rooms, in the working room and in the attic. The results of the isokinetic air sampling using malt extract agar (MEA) as well as DG18 nutrient medium were summarised as follows: “The bacterial germ density was classified as low” (Kirchmair 2016, p. 3).
Swab samples at the surfaces of supply air ducts
Swab samples were taken from the surfaces in front of the heat exchanger as well as at the surface of the supply air ducts of the children’s room and the attic. The result was summarised by Kirchmair as “The plates showed only little mould growth. There is no indication of mould.” (Kirchmair 2016, p. 5).
Filter material samples
The same holds for the evaluation of the filter probes, which were diluted with saline and applied to the nutrient media: “The filter was unloaded. The dust sample had a common germ density and seed composition. There is no indication of increased mould load.” (Kirchmair 2016, p. 6).
Summary of hygiene inspection and recommendations
The results of the hygiene examination of the ventilation system and the indoor air in the Passive House Darmstadt Kranichstein building after an operating period of 25 years show no evidence of increased germ density or mould contamination. Although the system has never been cleaned during the entire operating period, both the optical findings (visual inspection and camera inspection) in the supply air duct network and the microbiological laboratory findings have a perfect hygiene status. This is due to the high efficiency of the front-end fine filter, which was changed regularly. The filter change cycle depends on the outdoor air quality; in this case, it was regularly changed once a year. In case of discontinuous operation (system out of operation in summer period, which was not the case here), the filter should be changed before restart.
The use of F8 or F9 (ePM1 80%) filters in the outdoor air stream can therefore be fully recommended for future plant design; an at least annual filter change is advisable. In general, changing the filter is cheaper than cleaning the duct system. Additionally, the correct filter seat (tightness in the filter box) should be checked to avoid air bypasses.
From today’s point of view, the use of jet nozzles and thus shorter ducts is recommended, thus cleaning and maintenance is easier. The ability to dismantle the heat exchanger is useful for hygiene reasons (possibility for cleaning) and already standard in today’s devices.
From the point of view of the hygiene, the following planning and maintenance aspects must also be taken into account in all designs (it was taken care of this in the pilot project):
The location and design of the outdoor air intake and its minimum floor clearance must ensure that the least polluted outdoor air is drawn in. Short circuits with the exhaust air and other exhaust air systems (chimneys etc.) must be avoided. An intake directly above the soil is not permitted. The air ducts must be made of abrasion-resistant smooth-walled material and must be accessible for cleaning (sufficient number of inspection openings). The free drainage of the condensate tray has to be ensured; also here, the accessibility for the cleaning is important.
Power consumption and heat recovery rate
Each dwelling has a central heat exchanger with two electronically commuted direct-current (ECM) ventilators. On average, power consumption under normal operation is 29.4 W, producing a specific demand of 0.27 Wh/m3. This value is exceptionally low for ventilation systems with heat recovery. Wireless data loggers were used to measure temperatures and humidity in the central unit’s air flows; Fig. 19 shows the profiles in a typical winter season. The ventilation unit has an effective heat recovery rate of 82 (2)%. Including passive preheating, the overall system has a heat recovery rate of about 86%, so the ventilation system consumes 257 kWhel/a, compared to a greater than 2000 kWhheat/a reduction of heating energy consumption. The effective seasonal performance is therefore 7.8 kWh/kWh.
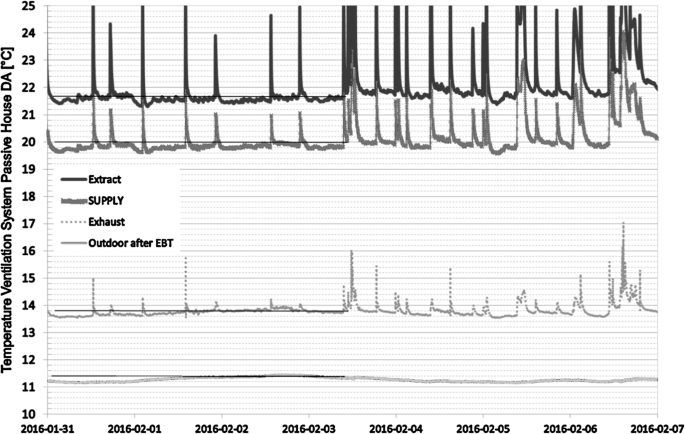
Temperature profiles of the airflows within the ventilation unit (February 2016). The counter-flow heat exchanger thus has a heat recovery rate of 82 (2)% (in not condensing conditions). This value has not changed (within measurement tolerance) since first measured in 1991. Temperature peaks are caused by extract air from cooking in the kitchen (diagram: authors)
Condition of the system
The four central units (one in each dwelling) all look as good as new. The ducts do not have any deposits. In 2002, one of the systems had its two fans replaced, but the rest of the systems are unchanged—including ventilation ducts, noise dampers and supply/extract air valves. In our assessment, such a system can be used for an additional 25 years without comprehensive maintenance (aside from the annual filter change). The ECM ventilators are expected to have a service life of 15 to 20 years.
Conclusion: The ventilation systems in the pilot project are still clean and running smoothly after 25 years of constant use. There is no reason why the basic components (ducts, cases, filter boxes and counter-flow heat exchangers) could not be used for 50 years. Only the ventilators have a service life of 15 to 20 years; replacing them costs around 500€. The F8 (ePM1 80%) front filter concept has proven to be hygienic and useful: The outdoor/supply air tract does not need cleaning. We now also recommend simple G3/G4 filters at the extract air valves. Tenants themselves can easily service these filters; with these filters installed, the extract/supply air ducts only need to be cleaned once within 10 years.
Conclusions
One of the reasons to give preference to passive components in the building envelope was the expectation that they would have long service life and maintenance intervals because of the lower building physical stress levels. These expectations proved correct for all components in the Kranichstein Passive House project investigated after 25 years. Especially surprising is that this outcome is also valid for the ventilation systems, whose basic components are now expected to serve also for more than 50 years. Along the same lines, the gas losses from the insulating triple pane low-e glazing units are so low that these can be used for at least two additional decades. The insulated structures of the envelope have not changed at all, and the airtightness concept chosen reproduced the original n50 value after 25 years—even though there have been several earthquakes in the area, such as on May 17, 2014. Some principles that led to this excellent result in terms of durability include the following:
-
Excellent insulation (U values less than 0.15 W/(m2K)) on the exterior of building components which was e.g. realised using an established external insulation compound system with just an appropriate thickness; the result is thus typical for a properly designed insulation in this type of masonry construction. The roof insulation is blown in mineral wool in a tilted roof using I-studs.
-
Well-planned airtight envelopes, including connections, especially plaster over airtightness films and the use of plaster connection strips and jointing which are the recommended solutions to use in masonry and mixed timber/masonry construction;
-
the use of a thick mineral plaster on exterior walls which improves the hygrothermal behaviour and leads to a very long durability; and
-
the use of a front ePM1 80% fine particle filter in the heat recovery ventilation system which keeps the whole system clean and allows a long durability providing healthy indoor air.
Each of these steps only increases construction costs marginally, though they help extend the service life to about 50 years. The improvements are also crucial for the success of reducing the heating energy demand by a factor of approx. ten compared to comparable average existing buildings. The result for the high energy conservation obtained by these measures has been confirmed in the whole period (including the latest years of the 25-year monitoring period) of this terraced house with four dwelling units. The result is not only lowered energy costs but also reduced the need for refurbishment and less dirt and noise for residents. In terms of the environment, a long service life of the original system (in this case, building and ventilation) is preferable to down-cycling and every other type of renewal and disposal.
With the investigation of this prototype building, combining both typical masonry and lightweight structures, after a 25-year period of normal use, it has been confirmed that the solutions based on the passive house concept offer a path to sustainable construction with a good life cycle balance: The energy consumption is negligible, stable over time, and, in addition, the durability of the components and the building is prolonged, including excellent indoor air quality and comfort. This is proven by the investigation and supported by the results for many other passive houses, following the same robust design principles of this standard, that also do not show any change in comfort and energy performance over time until now. Therefore, the passive house concept assures significantly lower life-cycle costs. In addition, it is easy to have full renewable energy coverage in such a passive house leading to a really robust, risk-reducing, cost-effective and sustainable solution.
References
Bott, H. (2014). Nachhaltige Stadtplanung. Berlin.
DIN 68800 Norm Holzschutz −2(2012) Vorbeugende bauliche Maßnahmen im Hochbau.
DIN ISO 16000-16. (2008). Innenraumluftverunreinigungen - Teil 16: Nachweis und Zählung von Schimmelpilzen - Probenahme durch Filtration (ISO 16000-16:2008).
DIN ISO 16000-17. (2008). Innenraumluftverunreinigungen - Teil 17: Nachweis und Zählung von Schimmelpilzen - Kultivierungsverfahren (ISO 16000-17:2008).
Feist, W. (Ed.) (1988/1992). Forschungsprojekt Passive Häuser. Institut Wohnen und Umwelt, Darmstadt 1988 (new edition with comments, Darmstadt, 1992).
Feist, W. (1993). Passivhäuser in Mitteleuropa, PhD thesis, University of Kassel.
Feist, W. (1994). Thermische Gebäudesimulation. Heidelberg.
Feist, W. (1997a). Passive house Darmstadt Kranichstein: planning, construction, results. Technical information 1997/4E. Darmstadt: Passive House Institute.
Feist, W. (1997b). Vergleich von Messung und Simulation. In Feist et al. (Eds.), Protokollband Nr. 5 des Arbeitskreis kostengünstige Passivhäuser (pp. 29–64). Darmstadt: Passivhaus Institut.
Feist, W., Holtmann, K. (1998). Erhöhter Glaseinstand kann Gefahr von thermisch induzierten Scheibensprüngen reduzieren. Gff (Glas Fenster Fassade), Issue 5.
Feist, W., Ebel, W., Peper, S., & Hasper, W. (2016a). Long-term experience and measurements from the first passive house building in Darmstadt-Kranichstein. In Feist et al. (Eds.), Proceedings of the 20th International Passive House Conference 2016 in Darmstadt (pp. 273–284). Darmstadt: Passive House Institute.
Feist, W., Pfluger, R., Peper, S., Hasper, W., Ebel, W., Schulz, T., & Saxer, A. (2016b). Studie zur Dauerhaftigkeit von Energieeffizienzmaßnahmen – Erfahrungen nach 25 Jahren Passivhaus Darmstadt-Kranichstein. Darmstadt: Passivhaus Institut.
Grunewald, J. (1997). Diffusiver und konvektiver Stoff- und Energietransport, PhD thesis, TU Dresden.
Hazucha, J. (2016). Konstrukcni Detaily pro Pasivni a Nulove Domy. Praha: GRADA Publishing.
Kirchmair, M. (2016). Laborbericht Nr. A-2015/6127. 18.04.2016.
PHPP. (2016). Passive house design package. Darmstadt: Passive House Institute 1998–2016 edition 2016.
Sumesh, C. G., Vinod, K. A., et al. (2013). Comparison study and thoron interference test of different radon monitors. Radiation Protection Dosimetry, 153(3), 309–315.
Techem. (2017). Energiekennwerte 2017. Eschborn: Techem Energy Services GmbH, Corporate Communications.
Troll, C., & Pfaffen, K. H. (1964). Karte der Jahreszeitenklimate der Erde. Erdkund. Arch. Wiss. Geogr., 18(1964), 5–28.
Weber, J.-E. (2016). New component database. In Feist et al. (Eds.), Proceedings of the 20th International Passive House Conference 2016 in Darmstadt (pp. 511–514). Darmstadt: Passive House Institute.
Wörner, D., von Bomhard, T. et al. (2015). Look Twice: Uncover hidden information in room climate sensor data. https://doi.org/10.1109/IOT.2014.7030110.
Acknowledgments
Open access funding provided by University of Innsbruck and Medical University of Innsbruck. The authors would like to thank Hesse’s Ministry of Economics, Energy, Transport and Development for its generous support of the project entitled “Durability of energy efficiency measures: Experience after 25 years of Passive House in Darmstadt Kranichstein” (reference number 2695 0458 2015 9062).
Author information
Authors and Affiliations
Corresponding author
Ethics declarations
Conflict of interest
The authors declare that they have no conflict of interest.
Additional information
Publisher’s note
Springer Nature remains neutral with regard to jurisdictional claims in published maps and institutional affiliations.
Rights and permissions
Open Access This article is distributed under the terms of the Creative Commons Attribution 4.0 International License (http://creativecommons.org/licenses/by/4.0/), which permits unrestricted use, distribution, and reproduction in any medium, provided you give appropriate credit to the original author(s) and the source, provide a link to the Creative Commons license, and indicate if changes were made.
About this article

Cite this article
Feist, W., Pfluger, R. & Hasper, W. Durability of building fabric components and ventilation systems in passive houses. Energy Efficiency 13, 1543–1559 (2020). https://doi.org/10.1007/s12053-019-09781-3
Received:
Accepted:
Published:
Issue Date:
DOI: https://doi.org/10.1007/s12053-019-09781-3