Electrostatic Precipitators as an Indoor Air Cleaner—A Literature Review

 , ,
, ,
Abstract
:1. Introduction
2. Operation of Electrostatic Precipitators
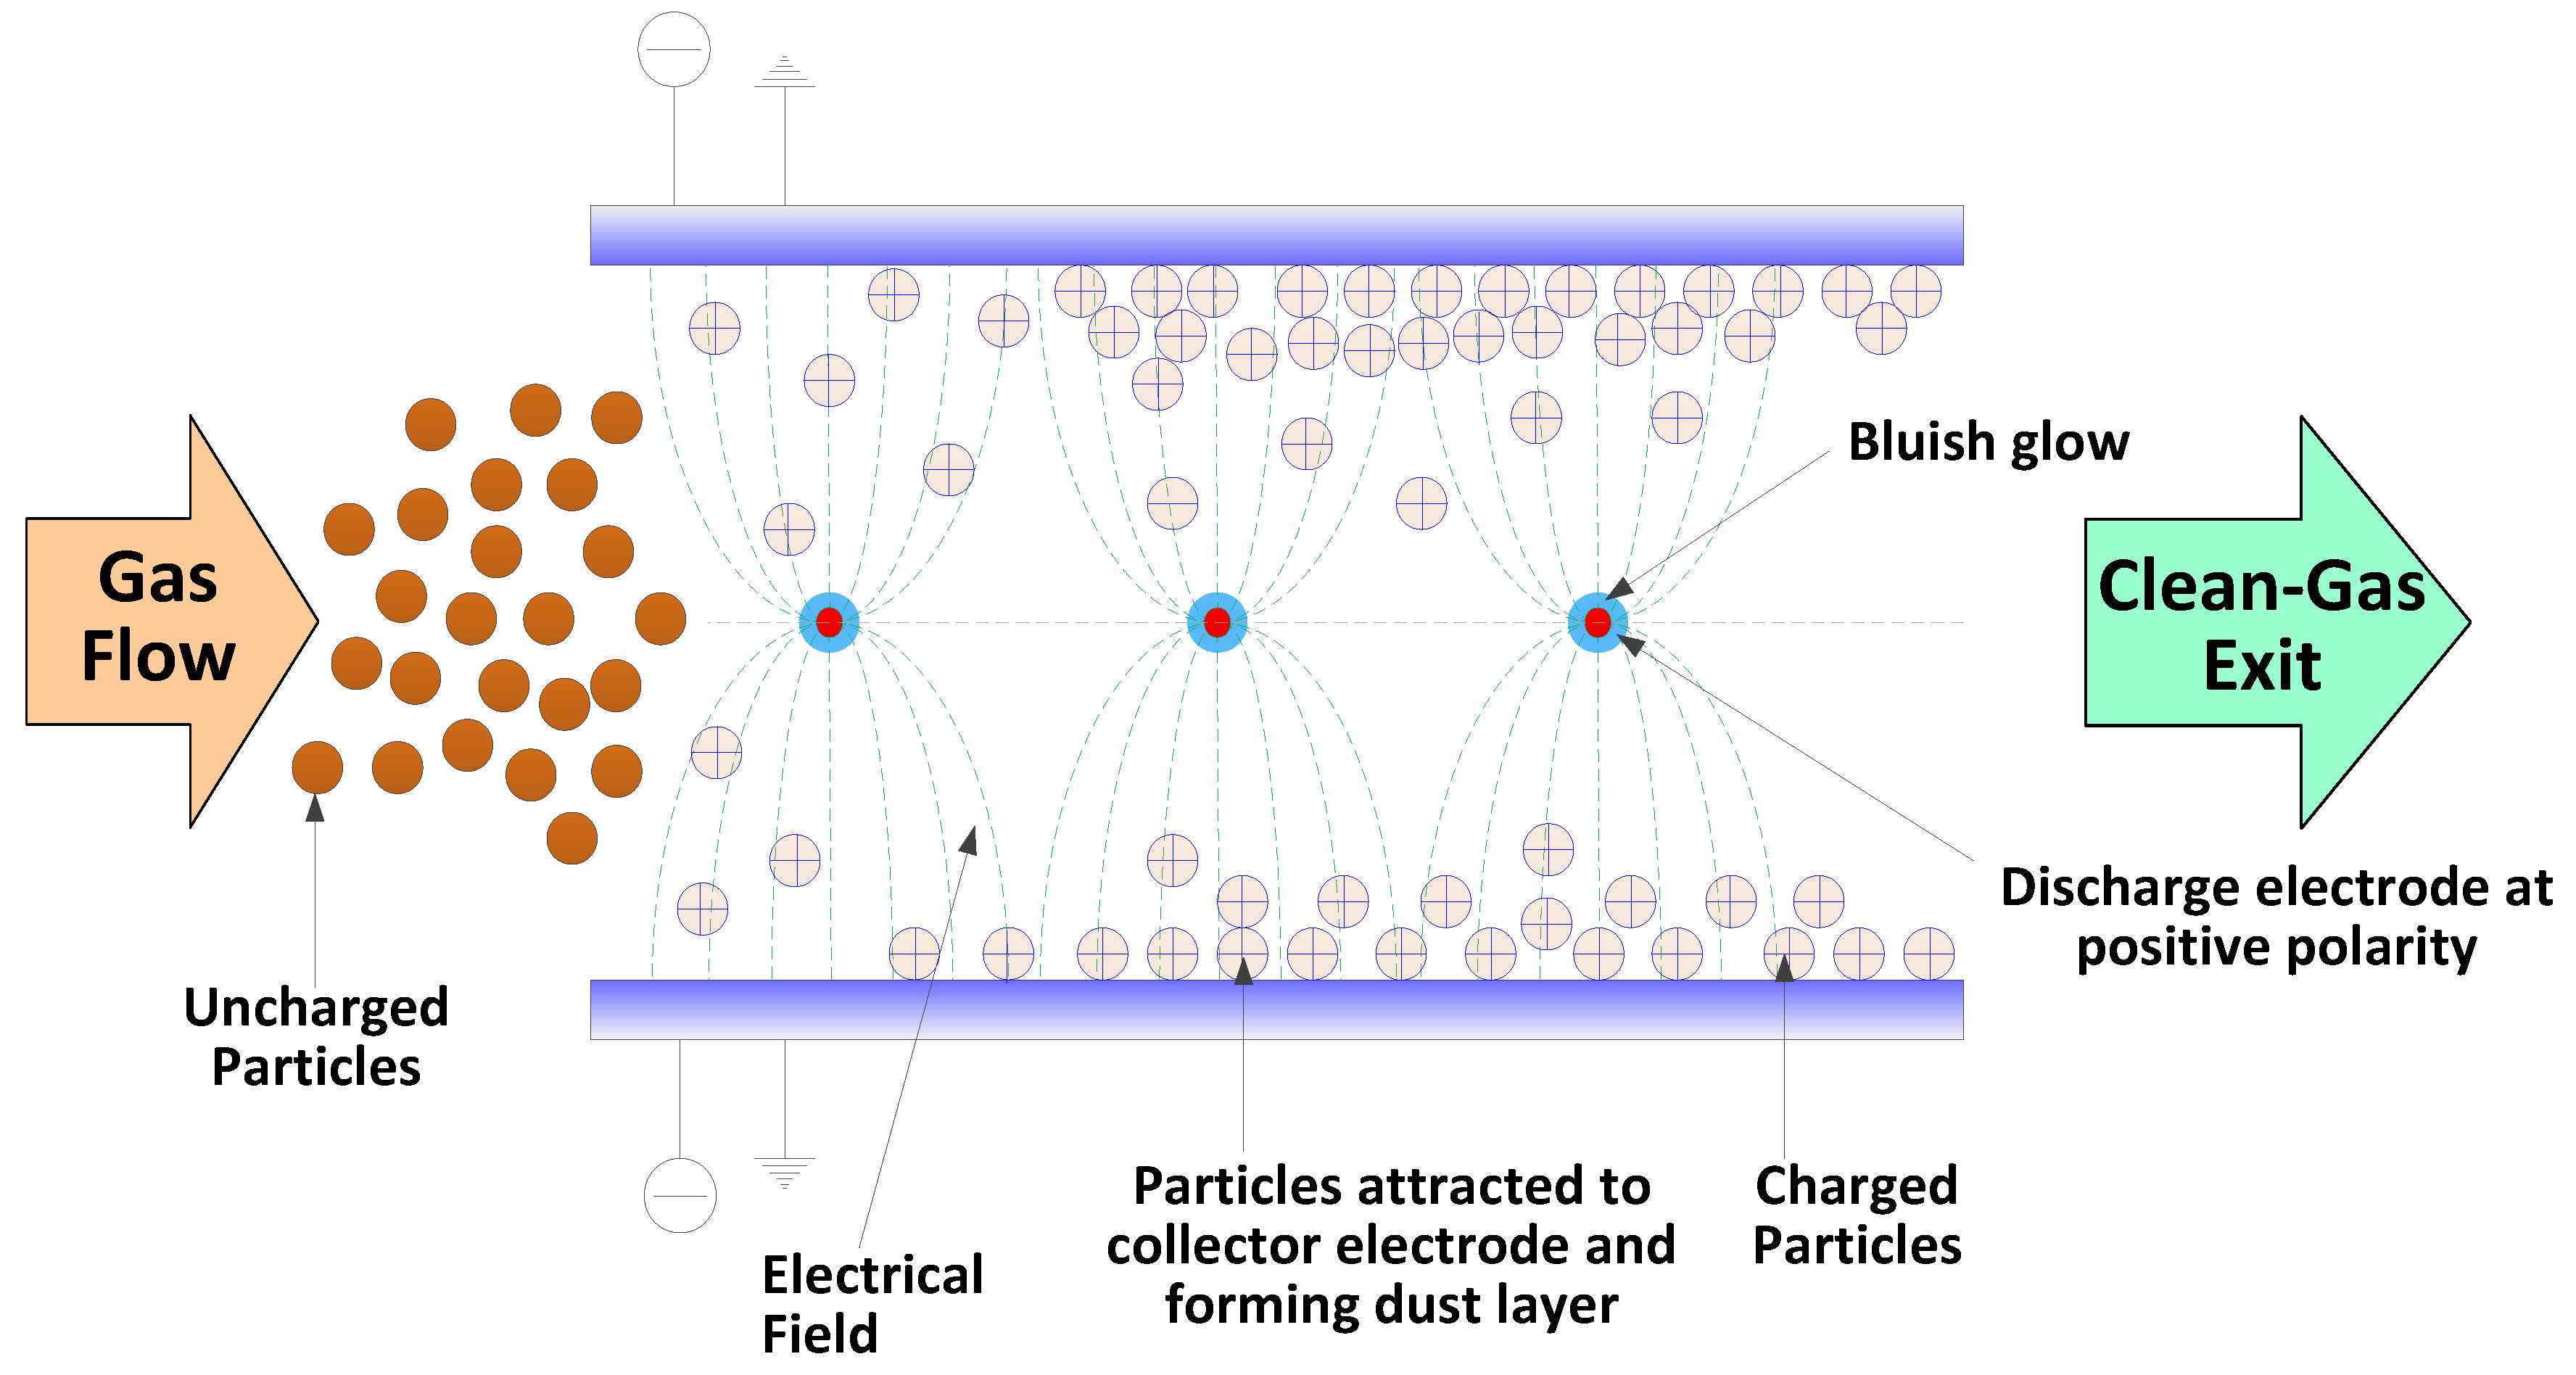
2.1. Principle of ESPs
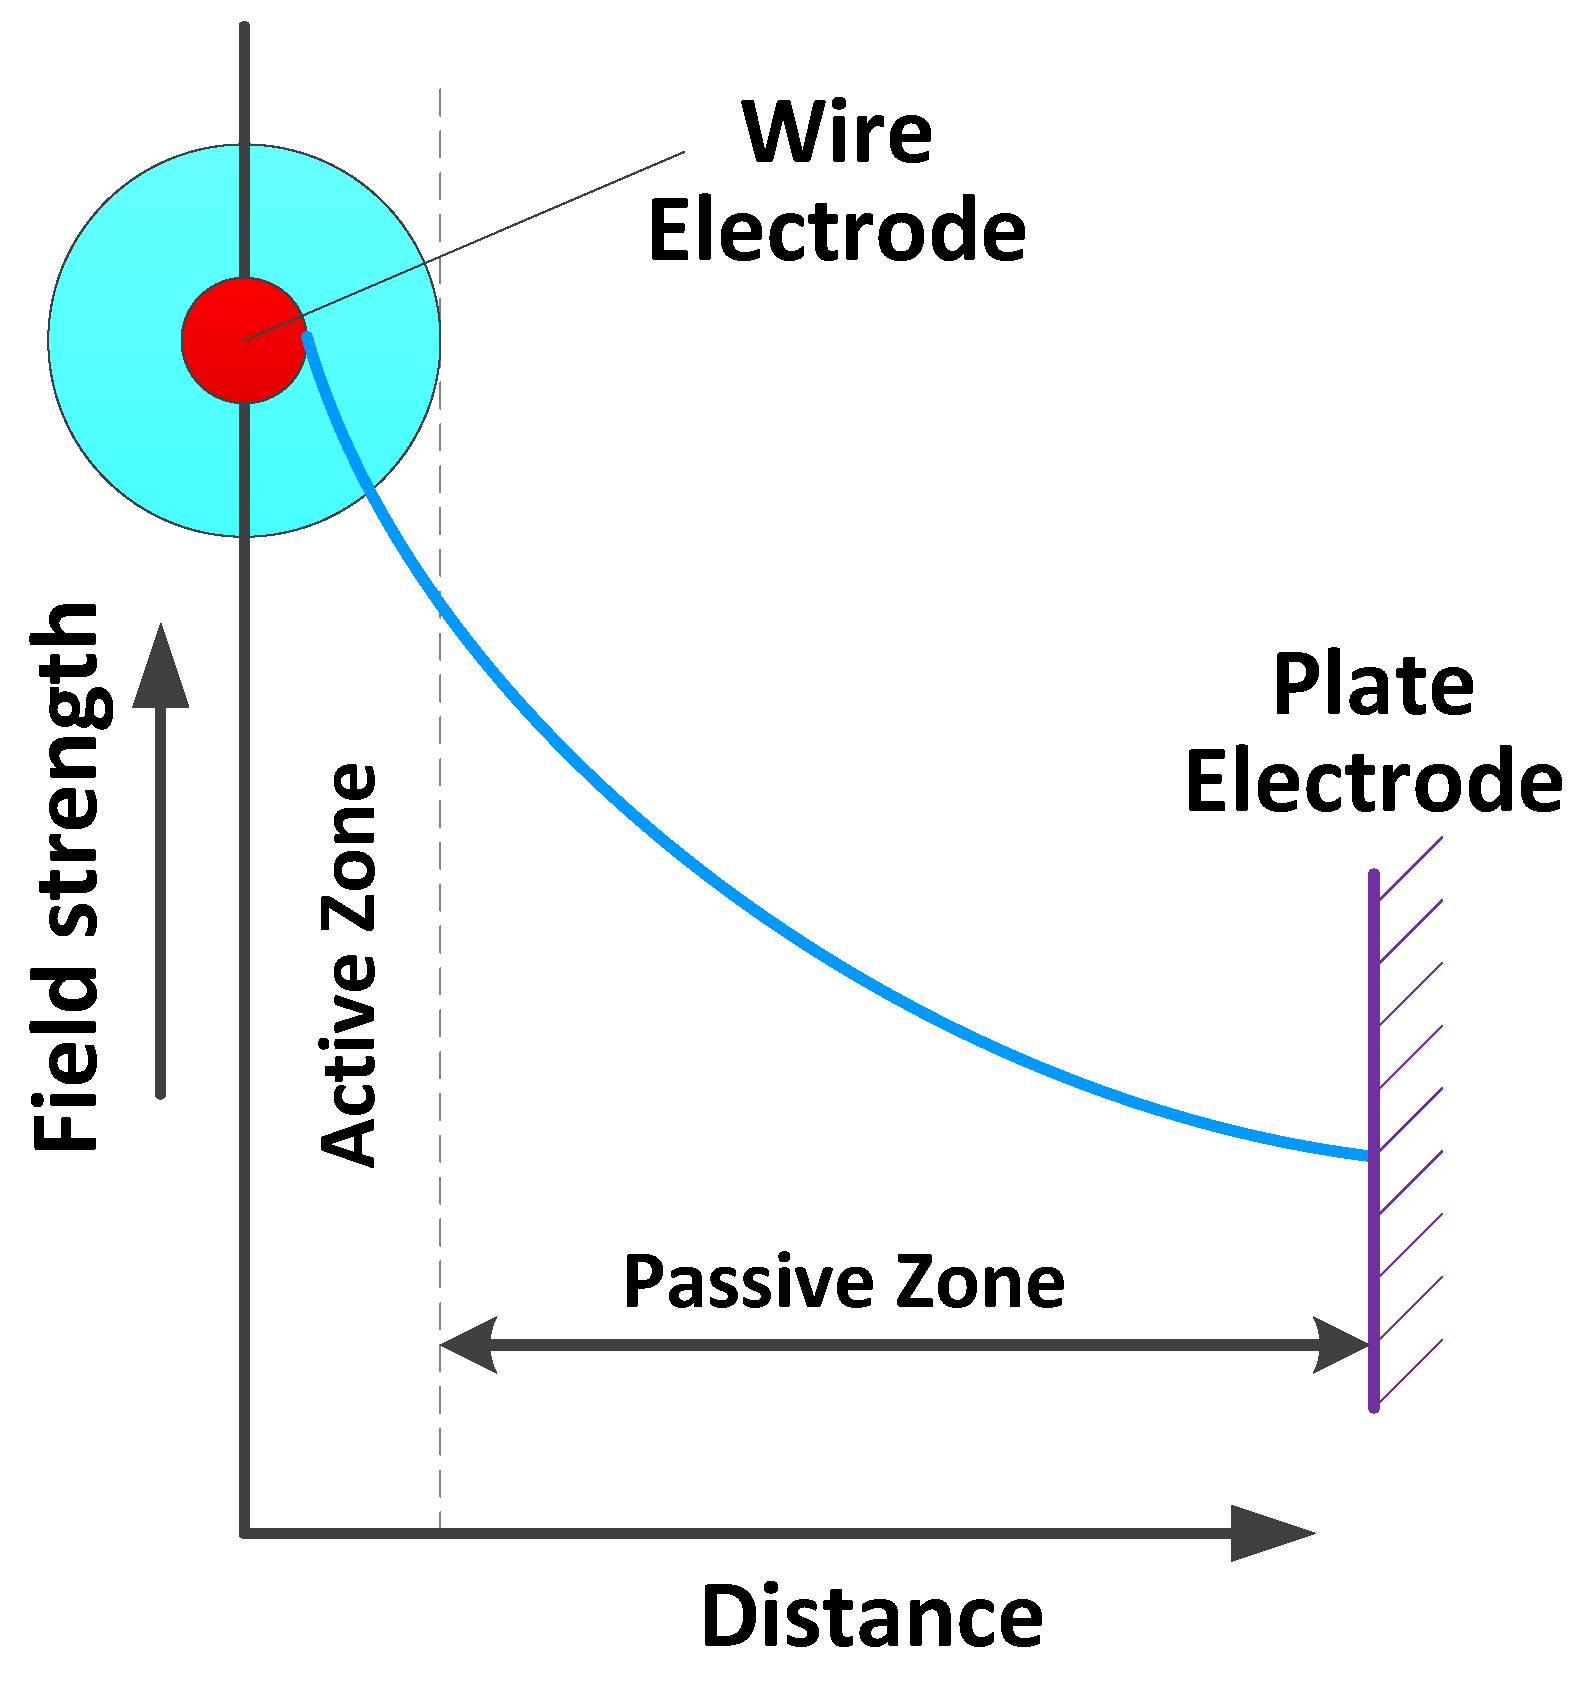
2.2. Corona Generation
2.3. Types of ESP
2.3.1. Single-Stage
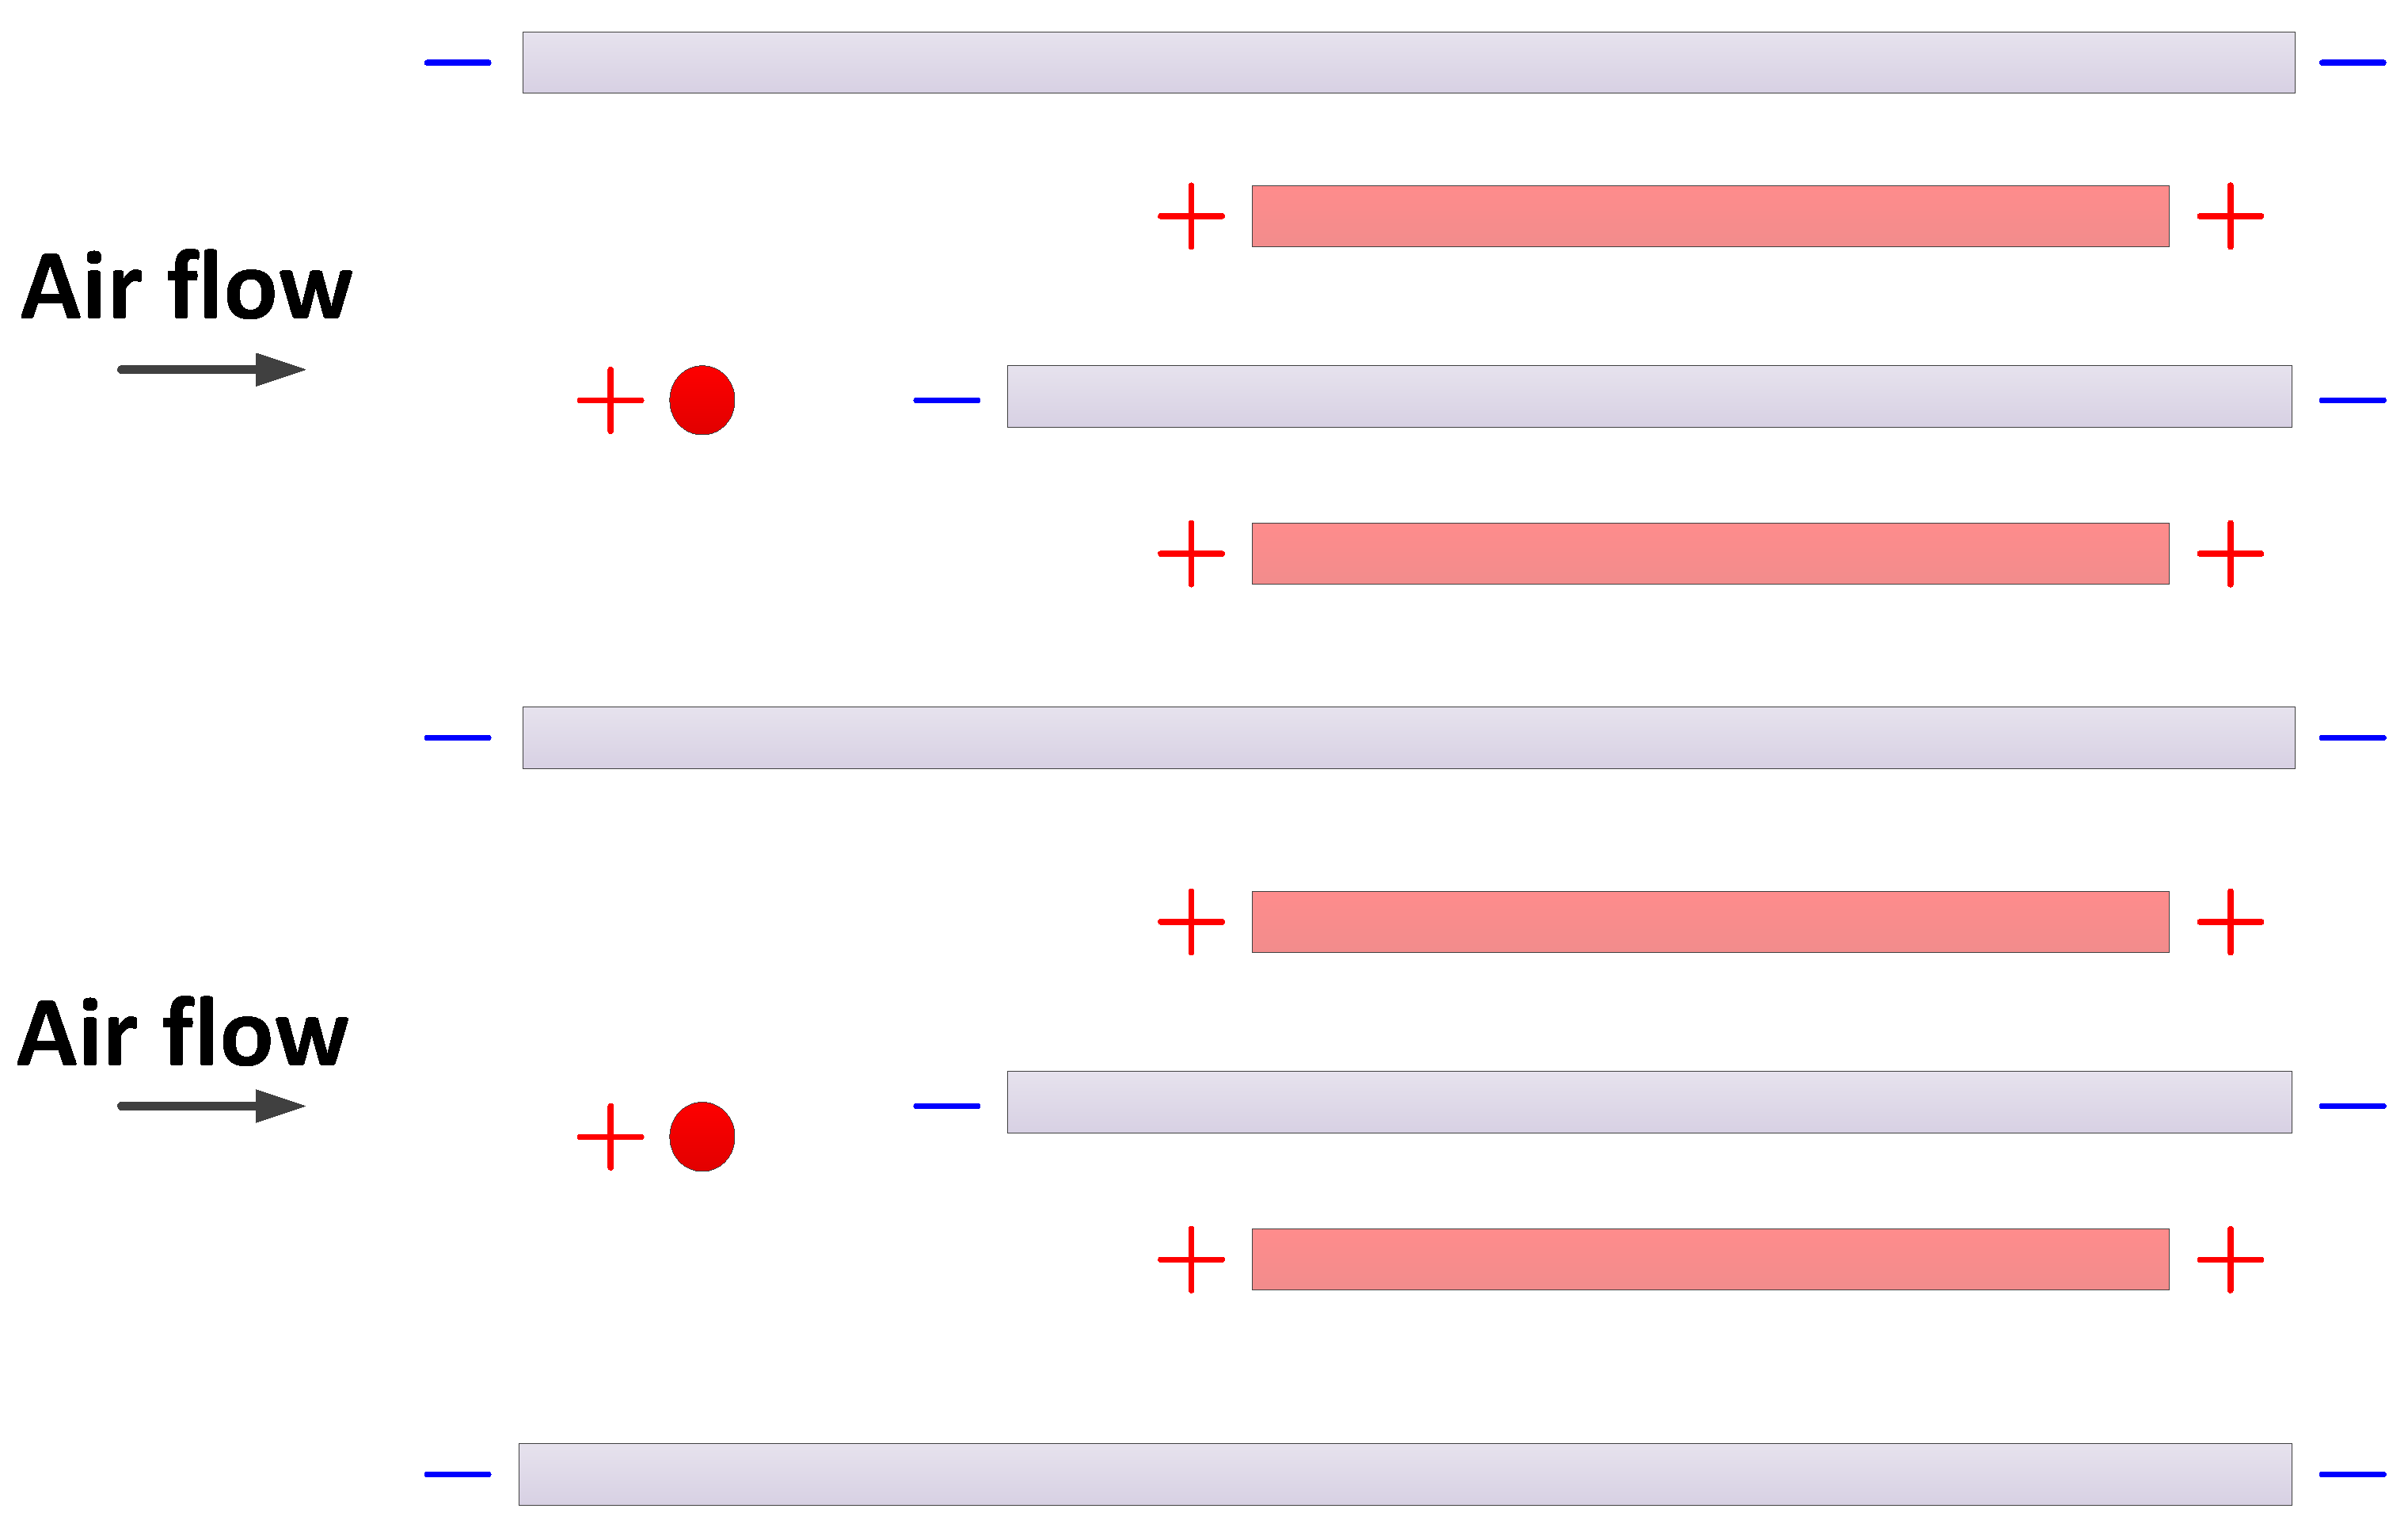
2.3.2. Two-Stage
3. Testing and Standards
3.1. Standards and Procedures for ESPs in Portable Air cleaning Units (PACs)
3.1.1. Particle Removal
3.1.2. Ozone Production
3.2. Standards and Procedures for ESPs in In-Duct Systems
3.2.1. Particle Removal
3.2.2. Ozone Generation
4. Measurements of Particle Removal in Field and Laboratory
Electrostatic Precipitator vs. Mechanical Filtration
5. By-Product and Secondary Emissions
5.1. Ozone
5.2. Ozone Generation Mechanism and Modelling
5.3. Factors Affecting the Ozone Generation Rate
5.4. Range of Measured Ozone Generation and Its Implication on IAQ
5.5. Other By-Products
6. Applications
6.1. Portable System
6.2. Short-Term Studies of ESPs in Chambers
6.3. Short-Term Studies of ESPs in Homes
6.4. Short-Term Studies of ESPs in Offices
6.5. Short-Term Studies of ESPs in Schools
6.6. Long-Term Studies of ESPs in Homes
6.7. Positioning of a Portable Air Cleaner
6.8. In-Duct System
7. Conclusions and Recommendations
- Both in-duct and portable air cleaners have advantages and disadvantages; in-duct units purify all the air entering the duct and consequently, distribute clean air to every room, through the supply devices; portable units only purify the air in the room in which they are placed, but have the advantage of reducing the risk due to cross contamination between rooms. Another minor advantage of in-duct units is no noise in comparison with portable units which have low levels of noise.
- Ozone is the major by-product of ESPs. The mechanisms suggest that the ozone generation rate can be affected by both product design and operating conditions. Product design factors that influence ozone generation include corona type and polarity, current density, discharge electrode/wire diameter, wire material, and the overall geometry of the air cleaner. Operating conditions that influence ozone generation/concentration include relative humidity, temperature, wire/electrode (and plate) contaminations, and the airflow rate. The reported ozone generation rates from ESPs range from below the detection limit to up to 162 mg/h. Standardized ozone generation testing is needed to ensure that they do not cause indoor ozone concentration to exceed the health guidelines.
- None of the available standards consider performance with respect to ultrafine particles.
- All standards focus on the determination of the performance of new, unused air cleaners. No test standards address the potential generation of by-products other than ozone.
- ESPs have the lowest noise generation of all tested units equipped with a fan, and in addition, ESPs use less power than other units.
- ESPs have a lower pressure drop compared to mechanical filters with comparable particle removal efficiencies.
- The positioning of a portable air cleaner also affects the overall particle removal and consequently, influences occupants’ exposure to particles.
- In HVAC applications, the ionizing electrode is typically spaced by tenths of millimeters from a grounded surface/electrode. Positive voltage is connected to a wire, spike, or needle, while the plate is grounded. This arrangement creates less corona/ionization, generates less ozone, and is thus more suitable for use in occupied spaces.
Author Contributions
Funding
Acknowledgments
Conflicts of Interest
Disclaimer
References
- Lipset, S.M.; Katchanovski, I. The future of private sector unions in the US. J. Labor Res. 2001, 22, 229–244. [Google Scholar] [CrossRef]
- Afshari, A.; Matson, U.; Ekberg, L.E. Characterization of indoor sources of fine and ultrafine particles: A study conducted in a full-scale chamber. Indoor Air 2005, 15, 141–150. [Google Scholar] [CrossRef] [PubMed]
- Song, S.; Lee, K.; Lee, Y.-M.; Lee, J.-H.; Lee, S.I.; Yu, S.-D.; Paek, D. Acute health effects of urban fine and ultrafine particles on children with atopic dermatitis. Environ. Res. 2011, 111, 394–399. [Google Scholar] [CrossRef] [PubMed]
- Strak, M.; Janssen, N.A.; Godri, K.J.; Gosens, I.; Mudway, I.S.; Cassee, F.R.; Lebret, E.; Kelly, F.J.; Harrison, R.M.; Brunekreef, B.; et al. Respiratory health effects of airborne particulate matter: The role of particle size, composition, and oxidative potential—The RAPTES project. Environ. Health Perspect. 2012, 120, 1183. [Google Scholar] [CrossRef] [Green Version]
- Lepeule, J.; Litonjua, A.A.; Coull, B.; Koutrakis, P.; Sparrow, D.; Vokonas, P.S.; Schwartz, J. Long-term effects of traffic particles on lung function decline in the elderly. Am. J. Respir. Crit. Care Med. 2014, 190, 542–548. [Google Scholar] [CrossRef] [Green Version]
- Wang, X.; Chen, R.; Meng, X.; Geng, F.; Wang, C.; Kan, H. Associations between fine particle, coarse particle, black carbon and hospital visits in a Chinese city. Sci. Total Environ. 2013, 458, 1–6. [Google Scholar] [CrossRef]
- Brook, R.D.; Rajagopalan, S.; Pope, C.A., III; Brook, J.R.; Bhatnagar, A.; Diez-Roux, A.V.; Holguin, F.; Hong, Y.; Luepker, R.V.; Mittleman, M.A. Particulate matter air pollution and cardiovascular disease: An update to the scientific statement from the American Heart Association. Circulation 2010, 121, 2331–2378. [Google Scholar] [CrossRef] [Green Version]
- Pope, C.A.; Brook, R.D.; Burnett, R.T.; Dockery, D.W. How is cardiovascular disease mortality risk affected by duration and intensity of fine particulate matter exposure? An integration of the epidemiologic evidence. Air Qual. Atmos. Health 2011, 4, 5–14. [Google Scholar] [CrossRef]
- Pope, C.A.; Burnett, R.T.; Thurston, G.D.; Thun, M.J.; Calle, E.E.; Krewski, D.; Godleski, J.J. Cardiovascular mortality and long-term exposure to particulate air pollution: Epidemiological evidence of general pathophysiological pathways of disease. Circulation 2004, 109, 71–77. [Google Scholar] [CrossRef] [Green Version]
- Sun, Q.; Hong, X.; Wold, L.E. Cardiovascular effects of ambient particulate air pollution exposure. Circulation 2010, 121, 2755–2765. [Google Scholar] [CrossRef]
- Bosseboeuf, D. Energy Efficiency Trends and Policies in the Household and Tertiary Sectors—An Analysis Based on the ODYSSEE and MURE Databases. 2015. Available online: http://www.odyssee-mure.eu/publications/br/energy-efficiency-trends-policies-buildings.pdf (accessed on 16 October 2020).
- Shaughnessy, R.; Sextro, R. What is an effective portable air cleaning device? A review. J. Occup. Environ. Hyg. 2006, 3, 169–181. [Google Scholar] [CrossRef] [PubMed]
- Novoselac, A.; Siegel, J.A. Impact of placement of portable air cleaning devices in multizone residential environments. Build. Environ. 2009, 44, 2348–2356. [Google Scholar] [CrossRef]
- Ardkapan, S.R.; Nielsen, P.V.; Afshari, A. Studying passive ultrafine particle dispersion in a room with a heat source. Build. Environ. 2014, 71, 1–6. [Google Scholar] [CrossRef]
- Hinds, W.C. Aerosol Technology: Properties, Behavior, and Measurement of Airborne Particles; John Wiley & Sons: Hoboken, NJ, USA, 2012. [Google Scholar]
- Kim, H.J.; Han, B.; Kim, Y.J.; Yoa, S.J. Characteristics of an electrostatic precipitator for submicron particles using non-metallic electrodes and collection plates. J. Aerosol Sci. 2010, 41, 987–997. [Google Scholar] [CrossRef]
- ANSI/AHAM. ANSI/AHAM AC-1: Method for Measuring Performance of Portable Household Electric Room Air Cleaners; Association of Home Appliance Manufacturers: Washington, DC, USA, 2006. [Google Scholar]
- GB/T-18801: Air Cleaner; Standardization Administration of China: Beijing, China, 2008.
- ASHRAE Position Document on Filtration and Air Cleaning; ASHRAE: Atlanta, GA, USA, 2015.
- Liu, D.H.; Liptak, B.G. Environmental Engineers’ Handbook, 2nd ed.; CRC Press: Boca Raton, FL, USA, 1997. [Google Scholar]
- Martins, A.A. Simulation of a wire-cylinder-plate positive corona discharge in nitrogen gas at atmospheric pressure. Phys. Plasmas 2012, 19, 063502. [Google Scholar] [CrossRef] [Green Version]
- Yan, P.; Zheng, C.; Xiao, G.; Xu, X.; Gao, X.; Luo, Z.; Cen, K. Characteristics of negative DC corona discharge in a wire-plate configuration at high temperatures. Sep. Purif. Technol. 2015, 139, 5–13. [Google Scholar] [CrossRef]
- Mizuno, A. Electrostatic precipitation. IEEE Trans. Dielectr. Electr. Insul. 2000, 7, 615–624. [Google Scholar] [CrossRef]
- USEPA. EPA Air Pollution Control Cost Manual, 6th ed.; EPA/452/B-02-001; United States Environmental Protection Agency: Washington, DC, USA, 2002.
- Crawford, M. Air Pollution Control Theory; McGraw-Hill: New York, NY, USA, 1976. [Google Scholar]
- Heinsohn, R.J.; Cimbala, J.M. Indoor Air Quality Engineering: Environmental Health and Control of Indoor Pollutants; CRC Press: Boca Raton, FL, USA, 2003. [Google Scholar]
- Zuraimi, M.; Nilsson, G.; Magee, R. Removing indoor particles using portable air cleaners: Implications for residential infection transmission. Build. Environ. 2011, 46, 2512–2519. [Google Scholar] [CrossRef]
- Chen, W.; Gao, Z.; Zhang, J.; Kosar, D.; Walker, C.; Novosel, D. Reduced Energy Use through Reduced Indoor Contamination in Residential Buildings; NCEMBT-061101; SMACNA: Washington, DC, USA, 2006. [Google Scholar]
- Lucerne University. Test Guideline for Portable Room Air Cleaners; Lucerne University, Engineering & Architecture: Lucerne, Switzerland, 2012. [Google Scholar]
- JIC. JIS C 9615 Air Cleaners; Japanese Standards Association: Centre for Integral Building Services Engineering: Tokyo, Japan, 1995. [Google Scholar]
- Standard XP B44-200. Independent Air Purification Devices for Tertiary Sector and Residential Applications—Test Methods—Intrinsic Performances; AFNOR (Association Française de Normalisation): Paris, France, 2011. [Google Scholar]
- ANSI/AHRI. ANSI/AHRI Standard 681: Performance Rating Residential Air Filter Equipment; Air-Conditioning, Heating, and Refrigeration Institute: Arlington, VA, USA, 2009. [Google Scholar]
- Waring, M.S.; Siegel, J.A.; Corsi, R.L. Ultrafine particle removal and generation by portable air cleaners. Atmos Environ. 2008, 42, 5003–5014. [Google Scholar] [CrossRef]
- AHAM. AHAM AC-3 Method for Measuring the Performance of Portable Household Electric Room Air Cleaners Following Accelerated Particulate Loading; Association of Home Appliance Manufacturers: Washington, DC, USA, 2009. [Google Scholar]
- ANSI/UL. UL Standard 867: Standard for Electrostatic Air Cleaners; Underwriters Laboratories Inc.: Northwood, IL, USA, 1988. [Google Scholar]
- CSA. CSA Standard 187: Electrostatic Air Cleaners; Canadian Standards Association: Toronto, ON, USA, 2009. [Google Scholar]
- ANSI/ASHRAE. ANSI/ASHRAE Standard 52.2.: Method of Testing General Ventilation Air-Cleaning Devices for Removal Efficiency by Particle Size; American Society of Heating, Refrigerating and Air Conditioning Engineers Peachtree Corners: Atlanta, GA, USA, 2012.
- Morrison, G.C.; Shaughnessy, R.; Siegel, J.A. In-Duct Air Cleaning Devices: Ozone Emission Rates and Test Methodology; California Air Resources Board, Research Division: Sacramento, CA, USA, 2014.
- California Air Resources Board. Air Cleaner Regulation (AB 2276). Available online: https://ww2.arb.ca.gov/our-work/programs/air-cleaners-ozone-products/air-cleaner-regulation-ab-2276 (accessed on 16 October 2020).
- Mølgaard, B.; Koivisto, A.J.; Hussein, T.; Hämeri, K. A new clean air delivery rate test applied to five portable indoor air cleaners. Aerosol Sci. Technol. 2014, 48, 409–417. [Google Scholar] [CrossRef]
- Tian, E.; Mo, J.; Long, Z.; Luo, H.; Zhang, Y. Experimental study of a compact electrostatically assisted air coarse filter for efficient particle removal: Synergistic particle charging and filter polarizing. Build. Environ. 2018, 135, 153–161. [Google Scholar] [CrossRef]
- Tian, E.; Mo, J. Toward energy saving and high efficiency through an optimized use of a PET coarse filter: The development of a new electrostatically assisted air filter. Energy Build. 2019, 186, 276–283. [Google Scholar] [CrossRef]
- Tian, E.; Xia, F.; Wu, J.; Zhang, Y.; Li, J.; Wang, H.; Mo, J. Electrostatic air filtration by multifunctional dielectric heterocaking filters with ultralow pressure drop. ACS Appl. Mater. Interfaces 2020, 12, 29383–29392. [Google Scholar] [CrossRef] [PubMed]
- Tian, E.; Gao, Y.; Mo, J. Electrostatically assisted air coarse filtration for energy efficient ambient particles removal: Long-term performance in real environment and influencing factors. Build. Environ. 2019, 164, 106348. [Google Scholar] [CrossRef]
- Tian, E.; Mo, J.; Li, X. Electrostatically assisted metal foam coarse filter with small pressure drop for efficient removal of fine particles: Effect of filter medium. Build. Environ. 2018, 144, 419–426. [Google Scholar] [CrossRef]
- Boelter, K.J.; Davidson, J.H. Ozone generation by indoor, electrostatic air cleaners. Aerosol Sci. Technol. 1997, 27, 689–708. [Google Scholar] [CrossRef]
- Viner, A.S.; Lawless, P.A.; Ensor, D.S.; Sparks, L.E. Ozone generation in DC-energized electrostatic precipitators. IEEE Trans. Ind. Appl. 1992, 28, 504–512. [Google Scholar] [CrossRef]
- Tanasomwang, L.; Lai, F. Long-term ozone generation from electrostatic air cleaners. In Proceedings of the Conference Record of the 1997 IEEE Industry Applications Conference Thirty-Second IAS Annual Meeting (IAS ’97), New Orleans, LA, USA, 5–9 October 1997. [Google Scholar]
- Chen, J.; Davidson, J.H. Ozone production in the positive DC corona discharge: Model and comparison to experiments. Plasma Chem. Plasma Process. 2002, 22, 495–522. [Google Scholar] [CrossRef]
- Chen, J.; Davidson, J.H. Ozone production in the negative DC corona: The dependence of discharge polarity. Plasma Chem. Plasma Process. 2003, 23, 501–518. [Google Scholar] [CrossRef]
- Kim, H.-J.; Han, B.; Kim, Y.-J.; Hwang, K.-D.; Oh, W.-S.; Yoo, S.-Y.; Oda, T. Fine particle removal performance of a two-stage wet electrostatic precipitator using a nonmetallic pre-charger. J. Air Waste Manag. 2011, 61, 1334–1343. [Google Scholar] [CrossRef]
- Huang, S.-H.; Chen, C.-C. Filtration characteristics of a miniature electrostatic precipitator. Aerosol Sci. Technol. 2001, 35, 792–804. [Google Scholar] [CrossRef]
- Tung, T.C.; Niu, J.; Burnett, J.; Hung, K. Determination of ozone emission from a domestic air cleaner and decay parameters using environmental chamber tests. Indoor Built Environ. 2005, 14, 29–37. [Google Scholar] [CrossRef]
- Bo, Z.; Yu, K.; Lu, G.; Mao, S.; Chen, J.; Fan, F.-G. Nanoscale discharge electrode for minimizing ozone emission from indoor corona devices. Environ. Sci. Technol. 2010, 44, 6337–6342. [Google Scholar] [CrossRef] [PubMed]
- Liu, L.; Guo, J.; Li, J.; Sheng, L. The effect of wire heating and configuration on ozone emission in a negative ion generator. J. Electrost. 2000, 48, 81–91. [Google Scholar] [CrossRef]
- Yun, S.J.; Min, B.R.; Seo, Y. A novel polymer-arrayed electrostatic precipitator with electrical resistance material for the removal of fine particles. J. Aerosol Sci. 2013, 57, 88–95. [Google Scholar] [CrossRef]
- Dorsey, J.A.; Davidson, J.H. Ozone production in electrostatic air cleaners with contaminated electrodes. IEEE Trans. Ind. Appl. 1994, 30, 370–376. [Google Scholar] [CrossRef]
- Jakober, C.; Phillips, T. Evaluation of Ozone Emissions from Portable Indoor Air Cleaners: Electrostatic Precipitators and Ionizers; California Environmental Protection Agency, Air Resources Board: Sacramento, CA, USA, 2008.
- Niu, J.; Tung, T.C.; Burnett, J. Ozone emission rate testing and ranking method using environmental chamber. Atmos. Environ. 2001, 35, 2143–2151. [Google Scholar] [CrossRef]
- Poppendieck, D.G.; Rim, D.; Persily, A.K. Ultrafine particle removal and ozone generation by in-duct electrostatic precipitators. Environ. Sci. Technol. 2014, 48, 2067–2074. [Google Scholar] [CrossRef]
- Morrison, G.; Shaughnessy, R.; Shu, S. Setting maximum emission rates from ozone emitting consumer appliances in the United States and Canada. Atmos. Environ. 2011, 45, 2009–2016. [Google Scholar] [CrossRef]
- Weschler, C.J.; Shields, H.C. Indoor ozone/terpene reactions as a source of indoor particles. Atmos. Environ. 1999, 33, 2301–2312. [Google Scholar] [CrossRef]
- Skulberg, K.R.; Skyberg, K.; Kruse, K.; Eduard, W.; Levy, F.; Kongerud, J.; Djupesland, P. The effects of intervention with local electrostatic air cleaners on airborne dust and the health of office employees. Indoor Air 2005, 15, 152–159. [Google Scholar] [CrossRef]
- Britigan, N.; Alshawa, A.; Nizkorodov, S.A. Quantification of ozone levels in indoor environments generated by ionization and ozonolysis air purifiers. J. Air Waste Manag. Assoc. 2006, 56, 601–610. [Google Scholar] [CrossRef] [Green Version]
- Hubbard, H.; Coleman, B.; Sarwar, G.; Corsi, R. Effects of an ozone-generating air purifier on indoor secondary particles in three residential dwellings. Indoor Air 2005, 15, 432–444. [Google Scholar] [CrossRef] [PubMed]
- Wallace, L. Effectiveness of Home Air Cleaners in Reducing Indoor Levels of Particles; Technical Report for Health Canada: Ottawa, ON, Canada, 2008. [Google Scholar]
- Shaughnessy, R.J.; Levetin, E.; Blocker, J.; Sublette, K.L. Effectiveness of portable indoor air cleaners: Sensory testing results. Indoor Air 1994, 4, 179–188. [Google Scholar] [CrossRef]
- Nazaroff, W.W. Effectiveness of air cleaning technologies. In Proceedings of the Healthy Buildings, Espoo, Finland, 6–10 August 2000. [Google Scholar]
- Kinzer, K.; Moreno, R. Performance comparison of residential in-duct air cleaning devices. Fluid Part Sep. J. 1997, 10, 233–241. [Google Scholar]
- Ardkapan, S.R.; Afshari, A.; Bergsøe, N.C.; Nielsen, P.V. Evaluation of air cleaning technologies existing in the Danish market: Experiments in a duct and in a test room. Indoor Built Environ. 2014, 23, 1177–1186. [Google Scholar] [CrossRef]
- Morawska, L.; Agranovski, V.; Ristovski, Z.; Jamriska, M. Effect of face velocity and the nature of aerosol on the collection of submicrometer particles by electrostatic precipitator. Indoor Air 2002, 12, 129–137. [Google Scholar] [CrossRef] [Green Version]
- Shaughnessy, R.; Levetin, E.; Sublette, K.; Blocker, J. Effectiveness of portable indoor air cleaners in particulate and gaseous contaminant removal. In Proceedings of the 6th International Conference on Indoor Air Quality and Climate-Indoor Air, Helsinki, Finland, 4–8 July 1993. [Google Scholar]
- King, J.G. Air for living. Respir. Care 1973, 2, 144–148. [Google Scholar]
- Hart, J.F.; Ward, T.J.; Spear, T.M.; Rossi, R.J.; Holland, N.N.; Loushin, B.G. Evaluating the effectiveness of a commercial portable air purifier in homes with wood burning stoves: A preliminary study. J. Environ. Public Health 2011. [Google Scholar] [CrossRef] [Green Version]
- Weichenthal, S.; Mallach, G.; Kulka, R.; Black, A.; Wheeler, A.J.; You, H.; St-Jean, M.; Kwiatkowski, R.; Sharp, D. A randomized double-blind crossover study of indoor air filtration and acute changes in cardiorespiratory health in a First Nations community. Indoor Air 2013, 23, 175–184. [Google Scholar] [CrossRef]
- Ardkapan, S.R. Removal of Ultrafine Particles from Indoor Environment: Experimental and Computational Studies of Possibilities, Limitations and Applications. Ph.D. Thesis, Aalborg University, Aalborg, Denmark, 2013. [Google Scholar]
- Wargocki, P.; Wyon, D.P.; Lynge-Jensen, K.; Bornehag, C.-G. The effects of electrostatic particle filtration and supply-air filter condition in classrooms on the performance of schoolwork by children (RP-1257). HVACR Res. 2008, 14, 327–344. [Google Scholar] [CrossRef]
- Mattsson, M.; Hygge, S. Effect of particulate air cleaning on perceived health and cognitive performance in school children during pollen season. Proc. Indoor Air 2005, 1, 1111–1115. [Google Scholar]
- Wallace, L.A.; Emmerich, S.J.; Howard-Reed, C. Effect of central fans and in-duct filters on deposition rates of ultrafine and fine particles in an occupied townhouse. Atmos. Environ. 2004, 38, 405–413. [Google Scholar] [CrossRef]
- Mermigkas, A.C.; Timoshkin, I.V.; MacGregor, S.J.; Given, M.J.; Wilson, M.P.; Wang, T. Removal of fine and ultrafine particles from air by microelectrostatic precipitation. IEEE Trans. Plasma Sci. 2013, 41, 2842–2850. [Google Scholar] [CrossRef]
- Park, S.; Hyun, O.; Cho, M.; Bae, H.; Lee, S.; Hur, H.; Choi, B.; Lee, Y.; Ahn, Y.; Lee, J. Performance evaluation of plasma air cleaning systems with ion impactor type electrodes for removing yellow sand dust. Part. Sci. Technol. 2013, 31, 541–546. [Google Scholar] [CrossRef]
- Schmid, S.; Seiler, C.; Gerecke, A.C.; Hächler, H.; Hilbi, H.; Frey, J.; Weidmann, S.; Meier, L.; Berchtold, C.; Zenobi, R. Studying the fate of non-volatile organic compounds in a commercial plasma air purifier. J. Hazard. Mater. 2013, 256, 76–83. [Google Scholar] [CrossRef]
- Podliński, J.; Niewulis, A.; Mizeraczyk, J. Electrohydrodynamic flow and particle collection efficiency of a spike-plate type electrostatic precipitator. J. Electrost. 2009, 67, 99–104. [Google Scholar] [CrossRef]
- Podliński, J.; Dekowski, J.; Mizeraczyk, J.; Brocilo, D.; Urashima, K.; Chang, J. EHD flow in a wide electrode spacing spike–plate electrostatic precipitator under positive polarity. J. Electrost. 2006, 64, 498–505. [Google Scholar] [CrossRef]
- Kim, H.J.; Han, B.; Kim, Y.J.; Oda, T.; Won, H. Submicrometer particle removal indoors by a novel electrostatic precipitator with high clean air delivery rate, low ozone emissions, and carbon fiber ionizer. Indoor Air 2013, 23, 369–378. [Google Scholar] [CrossRef]
- TRANE. Installation, Operation, Maintenance Manual 18-HE53D1-5. 2007. Available online: https://www.asdealernet.com/Resources/Literature/pdf/18-HE53D1-5_IGAT.pdf (accessed on 16 October 2020).
- Mo, J.; Tian, E.; Pan, J. New electrostatic precipitator with dielectric coatings to efficiently and safely remove sub-micro particles in the building environment. Sustain. Cities Soc. 2020, 55, 102063. [Google Scholar] [CrossRef]
- Filter Systems with Electrostatic Filter; GEA Piccotron Brochure; GEA: Dusseldorf, Germany, 2006.
- Zuraimi, M.; Tham, K. Reducing particle exposures in a tropical office building using electrostatic precipitators. Build. Environ. 2009, 44, 2475–2485. [Google Scholar] [CrossRef]
- Croxford, B.; Tham, K.W.; Young, A.; Oreszczyn, T.; Wyon, D. A study of local electrostatic filtration and main pre-filtration on airborne and surface dust levels in air-conditioned office premises. Indoor Air 2000, 10, 170–177. [Google Scholar] [CrossRef] [PubMed] [Green Version]


| Standard/Protocol (Ref.) | Country | Method | Challenge Particles | Measured Particle Size Range | Performance Index |
|---|---|---|---|---|---|
| Portable Air Cleaners | |||||
| ANSI/AHAM [17] | US | Pull-down | Environmental Tobacco Smoke Arizona Road Dust Paper Mulberry Pollen | 0.1 to 1.0 µm 0.5 to 3.0 µm 5 to 11 µm | CADR a |
| GB/T-18801 [18] | China | Pull-down | Environmental Tobacco Smoke Arizona Road Dust Paper Mulberry Pollen | 0.1 to 1.0 µm 0.5 to 3.0 µm 5 to 11 µm | CADR |
| NRC Protocol [27] | Canada | Pull-down | Polydisperse Potassium chloride (KCl) | 50 nm to 5 µm | CADR |
| NCEMBT Procedure [28] | US | Pull-down | Polydisperse potassium chloride (KCl) | 0.1 to 11.5 µm | CADR |
| Lucerne University (2012) [29] | Switzerland | Pull-down | ISO 12103-1 A1 Ultrafine test dust. | 0.2 to 5 μm | |
| JIS C 9615 [30] | Japan | Single-pass | JIS Z 8901 standard dusts | … | Removal rate |
| XP B44-200 [31] | France | Single-pass | DEHS, cat allergens, Staphylococcus epidermidis Aspergillus niger | 0.3 and 5 μm | SPE b, CADR |
| In-duct air cleaners | |||||
| ANSI/AHRI 681 [32] | US | Single-pass | Polydisperse potassium chloride (KCl) | 0.3 μm to 10 μm | SPE |
Publisher’s Note: MDPI stays neutral with regard to jurisdictional claims in published maps and institutional affiliations. |
© 2020 by the authors. Licensee MDPI, Basel, Switzerland. This article is an open access article distributed under the terms and conditions of the Creative Commons Attribution (CC BY) license (http://creativecommons.org/licenses/by/4.0/).
Share and Cite
Afshari, A.; Ekberg, L.; Forejt, L.; Mo, J.; Rahimi, S.; Siegel, J.; Chen, W.; Wargocki, P.; Zurami, S.; Zhang, J. Electrostatic Precipitators as an Indoor Air Cleaner—A Literature Review. Sustainability 2020, 12, 8774. https://doi.org/10.3390/su12218774
Afshari A, Ekberg L, Forejt L, Mo J, Rahimi S, Siegel J, Chen W, Wargocki P, Zurami S, Zhang J. Electrostatic Precipitators as an Indoor Air Cleaner—A Literature Review. Sustainability. 2020; 12(21):8774. https://doi.org/10.3390/su12218774
Chicago/Turabian StyleAfshari, Alireza, Lars Ekberg, Luboš Forejt, Jinhan Mo, Siamak Rahimi, Jeffrey Siegel, Wenhao Chen, Pawel Wargocki, Sultan Zurami, and Jianshun Zhang. 2020. "Electrostatic Precipitators as an Indoor Air Cleaner—A Literature Review" Sustainability 12, no. 21: 8774. https://doi.org/10.3390/su12218774