the Creative Commons Attribution 4.0 License.
the Creative Commons Attribution 4.0 License.
 | 07 Jan 2021
An in situ gas chromatograph with automatic detector switching between PTR- and EI-TOF-MS: isomer-resolved measurements of indoor air
Demetrios Pagonis
Zachary Finewax
Anne V. Handschy
Douglas A. Day
Wyatt L. Brown
John T. Jayne
Douglas R. Worsnop
Jose L. Jimenez
Paul J. Ziemann
Joost de Gouw
Brian M. Lerner
We have developed a field-deployable gas chromatograph (GC) with thermal desorption preconcentration (TDPC), which is demonstrated here with automatic detector switching between two high-resolution time-of-flight mass spectrometers (TOF-MSs) for in situ measurements of volatile organic compounds (VOCs). This system provides many analytical advances, including acquisition of fast time–response data in tandem with molecular speciation and two types of mass spectral information for each resolved GC peak: molecular ion identification from Vocus proton transfer reaction (PTR) TOF-MS and fragmentation pattern from electron ionization (EI) TOF-MS detection. This system was deployed during the 2018 ATHLETIC campaign at the University of Colorado Dal Ward Athletic Center in Boulder, Colorado, where it was used to characterize VOC emissions in the indoor environment. The addition of the TDPC-GC increased the Vocus sensitivity by a factor of 50 due to preconcentration over a 6 min GC sample time versus direct air sampling with the Vocus, which was operated with a time resolution of 1 Hz. The GC-TOF methods demonstrated average limits of detection of 1.6 ppt across a range of monoterpenes and aromatics. Here, we describe the method to use the two-detector system to conclusively identify a range of VOCs including hydrocarbons, oxygenates, and halocarbons, along with detailed results including the quantification of anthropogenic monoterpenes, where limonene accounted for 47 %–80 % of the indoor monoterpene composition. We also report the detection of dimethylsilanediol (DMSD), an organosiloxane degradation product, which was observed with dynamic temporal behavior distinct from volatile organosiloxanes (e.g., decamethylcyclopentasiloxane, D5 siloxane). Our results suggest DMSD is produced from humidity-dependent heterogeneous reactions occurring on surfaces in the indoor environment, rather than formed through gas-phase oxidation of volatile siloxanes.
- Article
(2303 KB) -
Supplement
(796 KB) - BibTeX
- EndNote


Historically, volatile organic compound (VOC) emissions from transportation were the most important air pollution source in urban environments (Gentner et al., 2017; Watson et al., 2001). However, with the success of emission-reduction strategies (Warneke et al., 2012; McDonald et al., 2013), other sources of anthropogenic VOCs are becoming significant in most developed nations, such as emissions from volatile chemical products (VCPs) (McDonald et al., 2018). VCPs consist of a large diversity of compounds, including oxygenated species like alcohols (e.g., glycols), esters, siloxanes, and carbonyls, along with hydrocarbons like alkanes, alkenes (e.g., monoterpenes), and aromatics (McDonald et al., 2018). This emission class stems from human activities such as the use of personal care products, paints, cleaning supplies, pesticide application, and the industrial use of solvents. Typically, VCPs are emitted in residential or commercial buildings, making their emissions highly variable both spatially and temporally, depending on the occupancy and activities occurring in the space (Weschler and Carslaw, 2018; Abbatt and Wang, 2020; Pagonis et al., 2019). To understand changing emission patterns, analytical instrumentation that can quantitatively detect these classes of VOCs with little ambiguity and high time resolution is needed, along with a range of studies to understand how emissions differ depending on the indoor environment and its use.
While indoor air quality has been studied for decades (Weschler and Shields, 1997; Wolkoff, 2013), recently the use of advanced gas-phase analysis techniques developed for atmospheric research, like in situ (real-time, direct air sampling) proton transfer reaction (PTR) and chemical ionization (CI) mass spectrometry (MS), have been applied for the characterization of indoor VOCs. These techniques have been used to characterize emissions in indoor environments such as a movie theater (Williams et al., 2016), art museum (Pagonis et al., 2019; Price et al., 2019), and university classroom (Liu et al., 2016, 2017; Tang et al., 2015, 2016) and to study how episodic events like cleaning and cooking impact indoor air quality (Wong et al., 2017; Kristensen et al., 2019; Lunderberg et al., 2019). While these studies conducted with PTR-MS and CIMS provide VOC emission signatures in a variety of environments, they often cannot provide molecular identification due to the detection of isobaric ions, which can be associated with multiple isomers, cluster ions, or fragmentation products that have the same molecular formula (Thompson et al., 2017). Without molecular identification, source apportionment and fate characterization remain difficult.
Improved molecular information can be gained by coupling gas chromatography (GC) with mass spectrometric detection (Warneke et al., 2003). Some studies have conducted offline GC measurements for indoor air research, which generally consist of sorbent tube or solid-phase microextraction (SPME) fiber collection with subsequent GC analysis (Gallagher et al., 2008; He et al., 2019; Sun et al., 2017; Liu et al., 2019). These studies focused on emissions from human skin and breath (Gallagher et al., 2008; He et al., 2019; Sun et al., 2017), with the exception of Liu et al. (2019), which utilized offline GC × GC analysis to study VOCs in a single-family home in northern California.
While these approaches provide some molecular identification and quantification, the low time resolution and time-consuming nature of offline methods, along with the potential for the introduction of artifacts due to sample handling between collection and analysis, are not ideal. In situ GC measurements of indoor environments are currently limited (Kristensen et al., 2019; Lunderberg et al., 2019; Rizk et al., 2018). During the single-family house study mentioned above (Liu et al., 2019), a semi-volatile thermal desorption aerosol gas chromatograph (SV-TAG) was deployed to make measurements during normal occupancy (Kristensen et al., 2019; Lunderberg et al., 2019). In the summer of 2018, an intensive indoor air study, HOMEChem, was conducted to study emissions and removal processes of gases and particles in a model home. This campaign included SV-TAG, an in situ four-channel GC with flame ionization detection (FID) and electron capture detection (ECD), and passive sampling for offline GC-MS samples (Farmer et al., 2019). The use of multiple types of chromatographic separation during this campaign illustrates the shift in focus for indoor air research toward more complete molecular analysis.
Building upon the research that has been conducted to study indoor environments, the ATHLETic center study of Indoor Chemistry (ATHLETIC) campaign was conducted during November of 2018 at the University of Colorado Dal Ward Athletic Center in Boulder, Colorado. The goal of ATHLETIC was to quantify the effects of human exercise, the use of chlorine-based cleaners, and other parameters on indoor air quality with instrumentation that provides high time resolution information and detailed characterization of both gases and particles. To address the need for high time resolution measurements and molecular identification of VOCs, we have developed an automated, field-deployable GC equipped with thermal desorption (TD) preconcentration and automated detector switching between two high-resolution time-of-flight mass spectrometers (HR-TOF-MS): a Vocus PTR-TOF-MS and an electron ionization (EI) TOF-MS for in situ measurements of VOCs. This system was deployed during the 2018 ATHLETIC campaign to characterize VOC emission profiles in the weight room facility. The instrument configuration and details of operation are discussed here, along with measurement results that were made possible through the analytical advances this technique offers. These results include the identification of a range of VOCs, including hydrocarbons, oxygenates, and halocarbons in the athletic center, along with details of their detection by both types of TOF-MS. We also report the quantification of anthropogenic monoterpenes and evidence of VOC emissions from humidity-dependent, heterogeneous reactions occurring on walls and surfaces in the indoor environment. The results presented here are a demonstration of this new GC-TOF-MS technique that produces three detailed and complementary data sets.
2.1 Instrument description
The GC-TOF-MS system consists of three main components: (1) a thermal desorption preconcentrator (TDPC) for sample collection, (2) a gas chromatograph (GC) for sample separation, and (3) high resolution time-of-flight mass spectrometers (HR-TOF-MS) for sample detection. Each of these components is described in the following sections. While the in situ GC can be operated with either the Vocus PTR-TOF-MS or EI-TOF-MS as individual detectors, coupling the GC with both detectors creates a technique that produces three complementary data sets: (1) real-time Vocus PTR-TOF-MS, (2) GC-Vocus PTR-TOF-MS, and (3) GC-EI-TOF-MS. Hereafter, these three techniques will be referred to as RT-Vocus, GC-Vocus, and GC-EI-TOF, respectively. It should be noted that the instrument described in this work and deployed for the ATHLETIC campaign was a prototype system used to demonstrate this technique. The instrument has been undergoing continued development to improve sensitivities and chromatographic performance and to extend the volatility range of resolved compounds since this campaign.
2.2 Thermal desorption preconcentration
Ambient VOCs are typically present at low mixing ratios (sub-ppb), and thus to increase GC-MS sensitivity a preconcentration method is required. For this study, the samples were collected using a simplified version of a thermal desorption preconcentrator (TDPC) (Aerodyne Research, Inc.). Briefly, the TDPC employed for this study relied upon a single-stage adsorbent trap for preconcentration of analytes. The design is based upon that of Tanner et al. (2006), and uses a commercial cold-plate Peltier thermoelectric cooler (CP-110, TE Technology) to allow for precise ambient to sub-ambient temperature regulation. Results from this TDPC have been described previously (Anderson et al., 2019). The system was simplified by not using water trapping or oxidant scrubbing before sample collection due to the expected low humidity and oxidant mixing ratios in this study. The sample trap was a commercial glass sorbent tube (TO-15/TO-17 cold trap, Markes International) operated at 20 ∘C during sample collection to avoid potential water condensation. The chosen sample trap was a multi-bed adsorbent trap equipped with three stages of adsorbents (Tenax, Carbopack X, Carboxen 1003; Markes International, personal communication, 2020) to expand the volatility range of compounds that can be trapped and desorbed for analysis. The combination of adsorbents in the TO-15/TO-17 trap allows for the analysis of a wide range of VOCs (including oxygenates) in the C2–C32n-alkane volatility range. However, for the system deployed for this work, the instrument was optimized for VOCs in the C5–C12 volatility range. Details of operational parameters (e.g., temperatures, flows) are described in Sect. 2.8.
2.3 Gas chromatograph
To separate analytes before detection with TOF-MS, a compact GC from Aerodyne Research Inc. (hereafter referred to as ARI GC) was used. The ARI GC is designed to be an in situ, field-deployable system. It fits into a 55 cm × 55 cm × 30 cm rack, weighs 24 kg, consumes 300 W of power during typical operation, and contains all hardware for GC sample collection and control of TDPC and GC flows and temperatures, including a make-up flow needed for GC-Vocus measurements (described in Sect. 2.8). Here, the flow path contained three two-position chromatography valves with Nitronic 60 valve bodies (VICI Instruments): one 10-port and two 6-port valves (Fig. 1b) to direct flows during the GC cycle. The chromatography valves and transfer lines (Sulfinert-treated 304-SS, 1.6 mm OD, 0.76 mm ID, Restek) are housed in a heated enclosure held at 150 ∘C. The carrier gas (UHP helium; Matheson) was controlled by a mass flow controller (MKS Technology) with variable set-point capability in the range of 0.1–10 cm3 min−1. The GC column is housed in a custom interlocking aluminum spindle (12 cm × 3 cm) with surface-mounted flexible resistive heaters, as described by Lerner et al. (2017). For this study, the ARI GC was configured as a one-channel system (single-column separation), with a 30 m Rxi-624 analytical column (Restek, 0.25 mm ID, 1.4 µm film thickness) installed in the spindle. This column resolves non- to mid-polarity VOCs including hydrocarbons, oxygenates, and nitrogen- and sulfur-containing compounds, with the exception of high-polarity compounds like carboxylic acids. The volatility range that the GC can resolve is a function of both the chosen GC column and the TDPC adsorbent trap. With the combination of column and adsorbent trap used for this study, the ARI GC was optimized for C5–C12 hydrocarbons, along with oxygen-, nitrogen-, halogen-, and sulfur-containing VOCs.

Figure 1Instrument schematics of (a) dual-detector GC-TOF-MS instrument configuration with valving shown for GC detector selection (EI-TOF or Vocus) and Vocus inlet source (room or supply air or GC effluent). (b) GC flow path and valve positions to incorporate a single-stage thermal desorption preconcentrator (TDPC), single column separation, and dual TOF-MS detection.
2.4 HR-TOF-MS detection
2.4.1 EI-TOF-MS
The electron ionization mass spectrometer used in this study is a Tofwerk EI-TOF-MS (Tofwerk AG) that has been described previously (Obersteiner et al., 2016). While the EI-TOF has nominal mass resolution up to 5000 m∕Δm, here it was operated with a resolution of 3900 at m∕z 69 to optimize both mass resolution and instrument sensitivity. During acquisition, mass spectra were averaged on a 6 Hz time base to obtain enough data points across each chromatographic peak. The ionizer temperature was kept at 280 ∘C, with ionization energy set to 70 eV and an electron emission current of 0.3 mA. The interface between the GC and both EI-TOF and Vocus is described in Sect. 2.8.
2.4.2 Vocus PTR-TOF-MS
The proton transfer reaction mass spectrometer used in this study is a Tofwerk Vocus PTR-TOF-MS (Tofwerk AG) described by Krechmer et al. (2018). It has nominal resolution of 12000 m∕Δm and was operated with a resolution of 11 500 at m∕z 150. The Vocus was operated with a data acquisition rate of 1 Hz for RT-Vocus and 5 Hz for GC-Vocus measurements. The focusing ion-molecule reactor direct current (DC) and radial frequency (RF) voltages were set to 500 and 450 V, respectively, and it was operated at a pressure of 1.5 mbar, giving a reduced electrical field (E∕N) of 150 Td. Additional details of Vocus operation during this campaign are given in Finewax et al. (2020).
2.4.3 Instrument control, data acquisition, and analysis
ARI GC operation is fully automated via a Labview-based (National Instruments, Inc) stand-alone executable in a Windows 10 OS environment (Microsoft) on one of the TOF-MS computers (here, the EI-TOF computer was used). The ARI GC communicates with the control computer via USB 2.0, with two communication devices (data board, serial communications board) required for operation. Each mass spectrometer is equipped with its own acquisition software (Tofwerk AG), the EI-TOF-MS operating TofDAQ v.1.99 and the Vocus using Igor Pro-based (Wavemetrics) Acquility v.2.3.6, which acts as a command shell and GUI interface for TofDAQ.
The analysis of high-resolution mass spectrometric data from both the EI-TOF and the Vocus was performed using Tofware (v3.1.2; TofWerk AG and Aerodyne Research, Inc.), where both nominal (unit mass resolution, UMR) and accurate (high-resolution, HR) data were used for analysis. Once the data had undergone mass calibration and high-resolution ion peak fitting, the data was then imported into GC analysis software, TERN (Aerodyne Research, Inc.). TERN is a software package based in Igor Pro that automatically calculates chromatographic peak areas, for either UMR or HR data, by mathematically fitting peak functions to the data rather than peak integration (Isaacman-VanWertz et al., 2017). Instrument calibration and data normalization procedures employed for this study are described in Sect. 2.9.
2.4.4 Measurement site
ATHLETIC was a 3-week study conducted at the University of Colorado Dal Ward Athletic Center in November 2018 in Boulder, Colorado. During the campaign, instruments were housed within the athletes' weight room and sampled from both inside the weight room (hereafter “room air”) and the supply air from the heating, ventilation, and air conditioning (HVAC) system. During the measurement period, the instruments switched between sampling the room and supply air every 10 min via an automated valve system. The weight room is serviced by the main air handling unit (AHU) of the building that circulates ≈ 400–1400 m3 min−1, of which 200 m3 min−1 is supplied to the weight room. The fraction of outside air that was mixed with the main AHU flow varied from ≈ 10 % to 80 % during this study. The volume of the weight room is ≈ 1700 m3, which corresponds to an average residence time of air in the weight room of ≈ 8.5 min, and an outdoor air exchange rate of 0.7–5.6 air changes per hour (ACH). The Dal Ward Athletic Center is directly adjacent to the University of Colorado football stadium, Folsom Field. The athletic center is to the north of the football stadium and to the northeast of a field house where cooking and other activities occurred before and during two football games that took place during this study on 10 and 17 November.
The campaign included additional instrumentation that sampled gases and particles. Although ATHLETIC was a 3-week study, the GC-TOF-MS system operated for a subset of the campaign. Here, only results from the GC-TOF-MS system will be presented along with relative humidity (RH) and temperature data collected using a Picarro Gas Analyzer (G2401) and building space temperature sensors located on the walls of the main floor of the weight room (provided and operated by CU Facilities Management). Room RH was derived from the building temperature and local pressure along with the H2O mixing ratio measured by the Picarro instrument. A separate analysis of RT-Vocus data, focusing on species not discussed here, is published elsewhere (Finewax et al., 2020).
2.4.5 Sample inlet
The ARI GC houses three separate sample inlets, an ambient inlet and two calibration gas inlets (Fig. 1b). The GC ambient inlet sampled from the weight room via a 3.4 m PFA (0.16 cm OD) sampling line with a 30 cm3 min−1 flow rate. The two calibration gas inlets are for pressurized gases where each inlet has a critical orifice inline to regulate flow followed by a solenoid shut-off valve. The calibration inlets operate by overflowing the ambient inlet during the sampling period; this excess flow is ensured by setting the pressure on the gas cylinder regulator based upon the critical orifice diameter (typical size 75 µm) installed upstream of the solenoid valves. For this study, the calibration gases were (1) a custom-made multicomponent calibration mixture, a certified natural gas standard (Restek) diluted with UHP nitrogen and (2) a zero gas (ultra zero grade air, Airgas) for system zeros. For RT-Vocus sampling, room air was sampled at 10 L min−1 through a 1.3 m length PFA Teflon inlet with 0.47 cm inner diameter (ID) that was shared by all instruments. Supply air was sampled at the same flow rate through a 4.3 m length of PFA Teflon with the same ID. From those shared inlets, 1.6 L min−1 was pulled through a 1.5 m PFA (0.16 cm ID) sampling line, where 100 cm3 min−1 was sampled into the Vocus and the remainder to excess. Sample selection (room versus supply air) was done via automated valve switching, and a makeup flow was applied to the inlet not being sampled to ensure continued inlet passivation. The RT-Vocus room air inlet and GC ambient inlet were separate but co-located in the weight room. The GC did not sample from the supply air during this study.
2.5 Sample acquisition, separation, and detection
At the start of the GC cycle (22 min), the sample was collected onto the adsorbent trap held at 20 ± 1 ∘C for 6 min at 30 cm3 min−1. The adsorbent trap was then backflushed for 1 min with 2 cm3 min−1 of UHP helium (Matheson) to remove oxygen and water from the trap. Next, the carrier flow was increased to 5 cm3 min−1 and the sample was thermally desorbed onto the GC column by flash heating the adsorbent trap to 225 ∘C for 20 s at 10.5 ∘C s−1. During this sample transfer, the GC column was held at 40 ∘C. To gauge the desorption efficiency, we would run a sample and then an instrument blank, with no sample flow through the trap during the collection period, to measure the residual sample remaining in the trap. The result of the instrument blank was <1 % of the signal measured for all reported compounds in the sample, indicating highly efficient transfer of sample, and this was deemed acceptable.
The method of chromatographic separation was as follows: after sample transfer the column temperature was held at 40 ∘C for 40 s, then ramped from 40 to 100 ∘C at 40 ∘C min−1, increased to 150 ∘C at 15 ∘C min−1, and finally increased to 225 ∘C at 30 ∘C min−1 and held at 225 ∘C for 100 s for a total chromatogram time of 9 min. Following the separation, the GC column was backflushed with UHP helium for 140 s, while being held at 235 ∘C and the sample trap was switched out of the path and backflushed with 2 cm3 min−1 UHP He while heated to 225 ∘C for 20 s to prepare the adsorbent trap for the next sample collection. After this cleaning period, the column was cooled and held at 40 ∘C over 575 s with continuous backflushing until the next sample transfer. Column flow rate was 2 cm3 min−1 of UHP helium controlled by a mass flow controller during sample transfer and chromatography, and by a critical orifice during backflushing.
After the chromatographic separation, the column effluent was automatically directed to either the EI-TOF or the Vocus for detection by switching the 3rd chromatography valve (Fig. 1). The ARI GC was coupled to the EI-TOF by a fused-silica capillary line (Siltek guard column, 0.25 mm ID, Restek) which passed through a heated capillary feed-through, kept at 230 ∘C, so that the GC effluent was directed into the ionization region of the EI-TOF. For GC-Vocus measurements, the ARI GC was coupled to the Vocus by a passivated stainless steel (Sulfinert-treated, 1.6 mm OD, 0.76 mm ID, Restek) transfer line heated to 150 ∘C. For GC-Vocus measurements, the total flow provided from the GC must be adequate for the Vocus ambient pressure inlet, which is fixed at 100 cm3 min−1 via a PEEK capillary tube and pressure controller. Since the GC column effluent flow rate is 2 cm3 min−1, an additional make-up flow of 100 cm3 min−1 of zero-grade air (Airgas) was introduced upstream of the GC-Vocus transfer line, downstream of the GC column (Fig. 1b).
2.6 Normalization of instrument response and calibration
Normalization of the EI-TOF data is required to account for changes in instrument sensitivity due to changes in detector response. For this study a normalization method that utilizes the detection of long-lived halocarbons in the atmosphere was used, as described previously by Lerner et al. (2017). Specifically, ambient carbon tetrachloride (CCl4) was used here to normalize the EI-TOF data, as no sources were expected in the weight room, consistent with a lack of significant variations in its time series. A normalization factor (NF) was calculated for each sample by dividing the GC peak area of CCl4 by the average CCl4 peak area for the entire campaign. The EI-TOF data was then corrected by dividing the raw data by the NF.
The Vocus signal is dependent on the concentration of the analyte, time spent in the ion-molecule reactor, the rate of reaction, and the concentration of the reagent ion (Yuan et al., 2017). Variability of analyte signal is reduced by normalizing to a constant reagent ion signal of 1×10⁶ counts per second (cps). During the ATHLETIC campaign, the largest signal observed in the Vocus was (H2O)3H+; actual ion concentrations in the reactor were dominated by H3O+ ions, but these are poorly measured due to mass discrimination in the quadrupole ion guide between the reactor and time-of-flight analyzer. Analyte signal was divided by (H2O)3H+ and multiplied by 1×10⁶ cps to obtain normalized signal. This method of normalization depends on the E∕N value used, which for this study was 150 Td. Monoterpene calibration of the RT-Vocus signal was accomplished immediately following the campaign, where a 6-point calibration of a gravimetric standard of limonene was diluted in zero air, resulting in a calibration factor of 139 ncps (normalized counts per second)/ppbv for C10H. The validity of using a single monoterpene to generate a general sensitivity for the RT-Vocus to represent the mixture of monoterpenes present in ambient air will be discussed in Sect. 3.3.1. Backgrounds for the Vocus were obtained using a zero-air generator for 30 s every 15 min and subtracted with linear interpolation between background collection periods (Krechmer et al., 2018).
At the end of the campaign both the GC-EI-TOF and GC-Vocus were calibrated for aromatic compounds and monoterpenes. This was accomplished by performing a 3-point calibration curve with duplicates for each detector using a 3 L Tedlar bag (Restek) containing 2 ppb each of BTEX (benzene, toluene, ethyl benzene, m-, p-, and o-xylene) and five monoterpenes. The calibration sample was made by diluting a standard solution of BTEX (Restek) with methanol (HPLC grade, Sigma-Aldrich) and creating a solution of five standard monoterpenes (α-pinene (99 %), β-pinene (99 %), camphene (96 %), carene (97 %), and limonene (99 %) (Sigma-Aldrich)) by diluting in hexanes (HPLC grade, Sigma-Aldrich). Using a glass micro-syringe, 5 µL of each of these solutions was then injected into a stream of UPH N2 (Airgas) flowing into the Tedlar bag at nominally 500 cm3 min−1. This mixture was attached to the sample inlet of the GC for calibrations. For the GC calibrations the sampling rate of the GC was kept constant (30 cm3 min−1), but the collection time was varied (1, 3, and 6 min of collection) to generate the calibration curves. This created a curve that gave instrument response (normalized counts; ncts) versus sample volume. By dividing the response at each sample volume by the compound concentration in the Tedlar bag, the instrument sensitivity (ncts ppb−1) was calculated. The difference in units between the RT-Vocus and the GC data should be noted; the RT-Vocus data is reported as normalized counts per second (ncps), while the GC data is given as normalized counts (ncts), the integration of detector response across the peak elution time. Figure S1 in the Supplement shows calibration curves of GC-TOF instrument sensitivity versus sample volume of selected monoterpenes. The limits of detection (LOD) were calculated as 3 times the standard deviation of the baseline multiplied by the full width at half maximum (FWHM) of the chromatographic peak and then divided by the sensitivity. Calibration results for both the GC-EI-TOF and GC-Vocus, including ions used for quantification, instrument sensitivity, LODs, and correlation coefficients (R2), are given in Table 1. From our calibration data, we estimate typical 1-σ uncertainties to be 12 % and 5 % for the GC-EI-TOF and GC-Vocus configurations, respectively, with typical precisions of 5 % and 1 %. The individual uncertainties for each calibrated compound reported from the GC are listed in Table S1. Available RT-Vocus sensitivities measured for this campaign are also reported in Table 1 for comparison with the GC sensitivities. The ambient GC data was converted to mixing ratio by dividing the normalized signal with the sensitivity. GC-Vocus chromatograms of both calibration and ambient indoor air are shown in Fig. S2 to demonstrate the chromatographic separation of this system.
Table 1Quantification ions, measured sensitivities (normalized counts per ppb; ncts/ppb), limits of detection (ppt), and linearity (R2) for compounds used for calibration of both the GC-EI-TOF and GC-Vocus. RT-Vocus sensitivities (normalized counts per second per ppb; ncps/ppb) for a subset of the compounds are included for comparison.
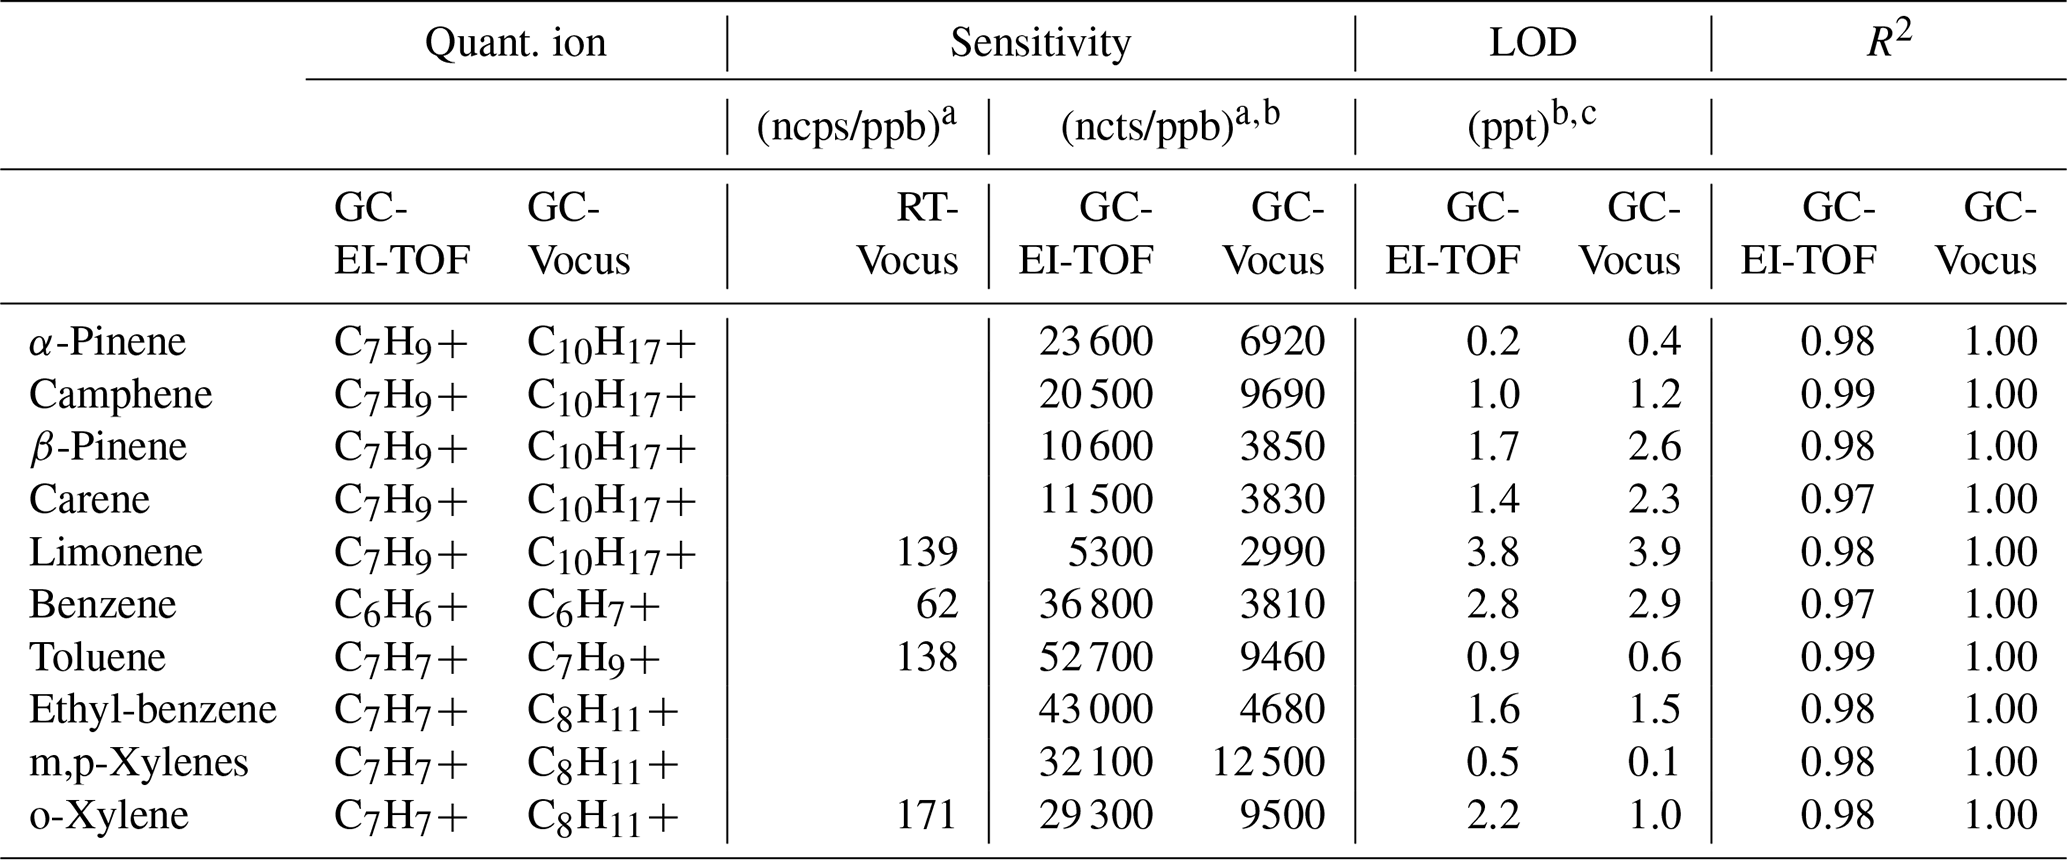
a The ncps and ncts for both RT- and GC-Vocus measurements are for a Vocus operation with E∕N = 150 Td. b Sensitivity and LOD for a sample volume of 180 cm3, the volume used for GC-TOF ambient sampling during the ATHLETIC campaign. c LOD calculated as 3 times the standard deviation of the baseline multiplied by the full width at half maximum (FWHM) of the chromatographic peak divided by the sensitivity.
3.1 Benefits of dual-detector system and instrument performance
The novelty of this system is the ability to produce three complementary data sets: (1) RT-Vocus, (2) GC-Vocus, and (3) GC-EI-TOF during routine operation. As shown in Fig. 1a, this setup allowed the Vocus to sample in real time from the weight room, the supply air, or the GC effluent. With this instrument configuration, the Vocus can make real-time measurements with fast time resolution (<1 Hz) or automatically switch to GC detection for molecular speciation. When the Vocus was not sampling from the GC, the column effluent was instead sent to the EI-TOF for detection (shown in Fig. 1a), which allowed continuous coverage of the GC identification measurements.
Another benefit of this system is that the two detectors use different ionization methods: proton transfer reaction (PTR) versus electron ionization (EI). By alternating between the detection methods, two sets of chromatograms were created with different types of information about each molecule (which had the same GC retention time regardless of the detector). For GC-Vocus chromatograms, the analytes are ideally detected as their protonated molecular ion [MH+]. The extent to which this is true depends on instrument operating parameters such as the reduced electric field (E∕N), where greater ratios tend to induce fragmentation due to increased collisions while also limiting the formation of cluster ions (Yuan et al., 2017). For GC-EI-TOF chromatograms, the analytes are detected by their ion fragments and identified with their EI fragmentation pattern. Benefits of EI detection, compared to PTR, is compound identification through fragmentation pattern matching (e.g., NIST/EPA/NIH mass spectral library, Linstrom and Mallard, 2020, https://webbook.nist.gov/chemistry/, last access: 23 December 2020) and the ability to detect compounds such as saturated hydrocarbons, which have a proton affinity that is too low for detection by PTR-MS (Yuan et al., 2017). However, since the Vocus generally detects an intact molecular ion, this can lead to a simpler analysis, where each compound is ideally detected as a single ion (giving the molecular formula of the protonated parent) rather than a series of fragments as with EI detection.
Calibration results (measured sensitivities, LODs, and R2 values) from both the GC-EI-TOF and GC-Vocus are reported in Table 1. A quantification ion was chosen for each method: for GC-Vocus this was the protonated molecular ion [MH+], and for GC-EI-TOF the most abundant fragment ion present in the mass spectrum was used. These ions were chosen because they generally result in the highest sensitivity due to their abundance; however, in select circumstances (e.g., interference such as co-elution) another ion may be chosen. The comparison of GC-EI-TOF and GC-Vocus sensitivities and LODs is a comparison of detector response since GC operation was identical for calibration of each detector. EI-TOF detection was on average 4.3 times more sensitive than detection by the Vocus. This increase in sensitivity implies higher ion counts at the detector for the EI-MS versus PTR-MS; this may be attributed to several parameters including ionization efficiency (Cappellin et al., 2012; Sekimoto et al., 2017; Harland and Vallance, 1997).
Available RT-Vocus sensitivities are also reported in Table 1 for comparison with those measured by the GC-Vocus. For the limited overlap of calibration compounds presented in this work, the GC-Vocus was on average 50 times more sensitive than the RT-Vocus. The gained sensitivity with the addition of the GC is due to differences in sample volume. When the Vocus is operating in the RT-Vocus mode, it samples ambient air at 100 cm3 min−1 with 1 s resolution, and thus each data point is representative of 1.7 cm3 of ambient air. However, sensitivity is gained with the addition of the GC due to preconcentration of sample, where 180 cm3 of ambient air is preconcentrated over the 6 min sample collection period before injection into the Vocus with typical peak widths here of ≤ 2 s (FWHM). The measured 50-fold increase in sensitivity agrees very well with the expected increase of a factor of 53, which is calculated by dividing the 180 cm3 sample preconcentrated by the GC and injected into the Vocus over a 2 s wide chromatographic peak (90 cm3 s−1) by the 1.7 cm3 s−1 analyzed by the RT-Vocus. The factor of 50 increase in sensitivity is due to the sampling schemes employed for this study. However, RT-Vocus LODs can be improved by averaging the signal to reduce noise. Figure S3 shows the Allan variance plot for the RT-Vocus C10H signal (protonated molecular ion of monoterpenes) during a relatively unperturbed, low-concentration sampling period of room air. The Allan variance plot shows a broad minimum around 250 s, indicating the maximum period of effective sample averaging; assuming Poisson statistics for the data, this averaging window reduces RT-Vocus noise by a factor of ∼16. This analysis shows that averaging the RT-Vocus data beyond 250 s would not decrease the noise further, as the RT-Vocus signal no longer follows Poisson statistics for these larger time periods, likely due to environmental factors such as changes in instrument temperature.
The GC LODs reported in Table 1 are a function of the standard deviation of the baseline surrounding the chromatographic peak, chromatographic peak width, and instrument sensitivity. Across these compounds, the LODs for each instrument are very similar, each averaging 1.6 ppt for a 180 cm3 sample (GC-EI-TOF LOD ppt; GC-Vocus LODavg = 1.7 ± 1.2 ppt). As discussed in Sect. 2.8, the GC-Vocus measurements include a 100 cm3 min−1 make-up flow for instrument operation. For this study, ultra zero air was used for the make-up flow, as a gas with low purity will create elevated baselines and negatively impact the instrument LODs.
For each detection method, the differences in sensitivity and LODs between isomers (e.g., α-pinene versus limonene) are primarily a function of the extent to which the compound fragments. The greatest sensitivity would occur if the ionization of an analyte resulted in zero fragmentation, so that all analyte signal was associated with a single ion. Instead, if a compound fragments, the signal associated with that analyte is spread out across multiple ions, taking signal away from the ion used for quantification and decreasing the sensitivity (and increasing the LOD). In the α-pinene versus limonene example given above, α-pinene fragments less than limonene, resulting in a greater sensitivity (and lower LOD) to the α-pinene monoterpene isomer.
3.2 Molecular identification of VOCs in an indoor environment
The GC data set was extensive and included detection of hydrocarbons, oxygenates and halocarbons in the volatility range of C5–C12 n-alkanes. Table 2 reports the EI characteristic ion and the ion(s) detected by the Vocus (typically a combination of the molecular ion [MH+], along with water clusters and/or fragments) for a subset of the chromatographic peaks that were identified through the GC analysis. These identified species include alcohols, aldehydes, ketones, ethers, nitrogen-containing compounds, halocarbons, siloxanes, alkanes, alkenes, and aromatics. It should be noted that not every compound listed in Table 2 can be reported quantitatively from the GC system due to breakthrough in the thermal desorption trap or other losses in the system. However, even for these species that are difficult to quantify, the GC is an excellent tool for compound identification. Specific results from the GC-TOF-MS system are reported in detail in Sect. 3.3 for monoterpenes and in Sect. 3.4 for dimethylsilanediol.
Table 2Compounds identified during the ATHLETIC campaign using the GC analysis with both EI-TOF-MS and Vocus PTR-TOF-MS detection.
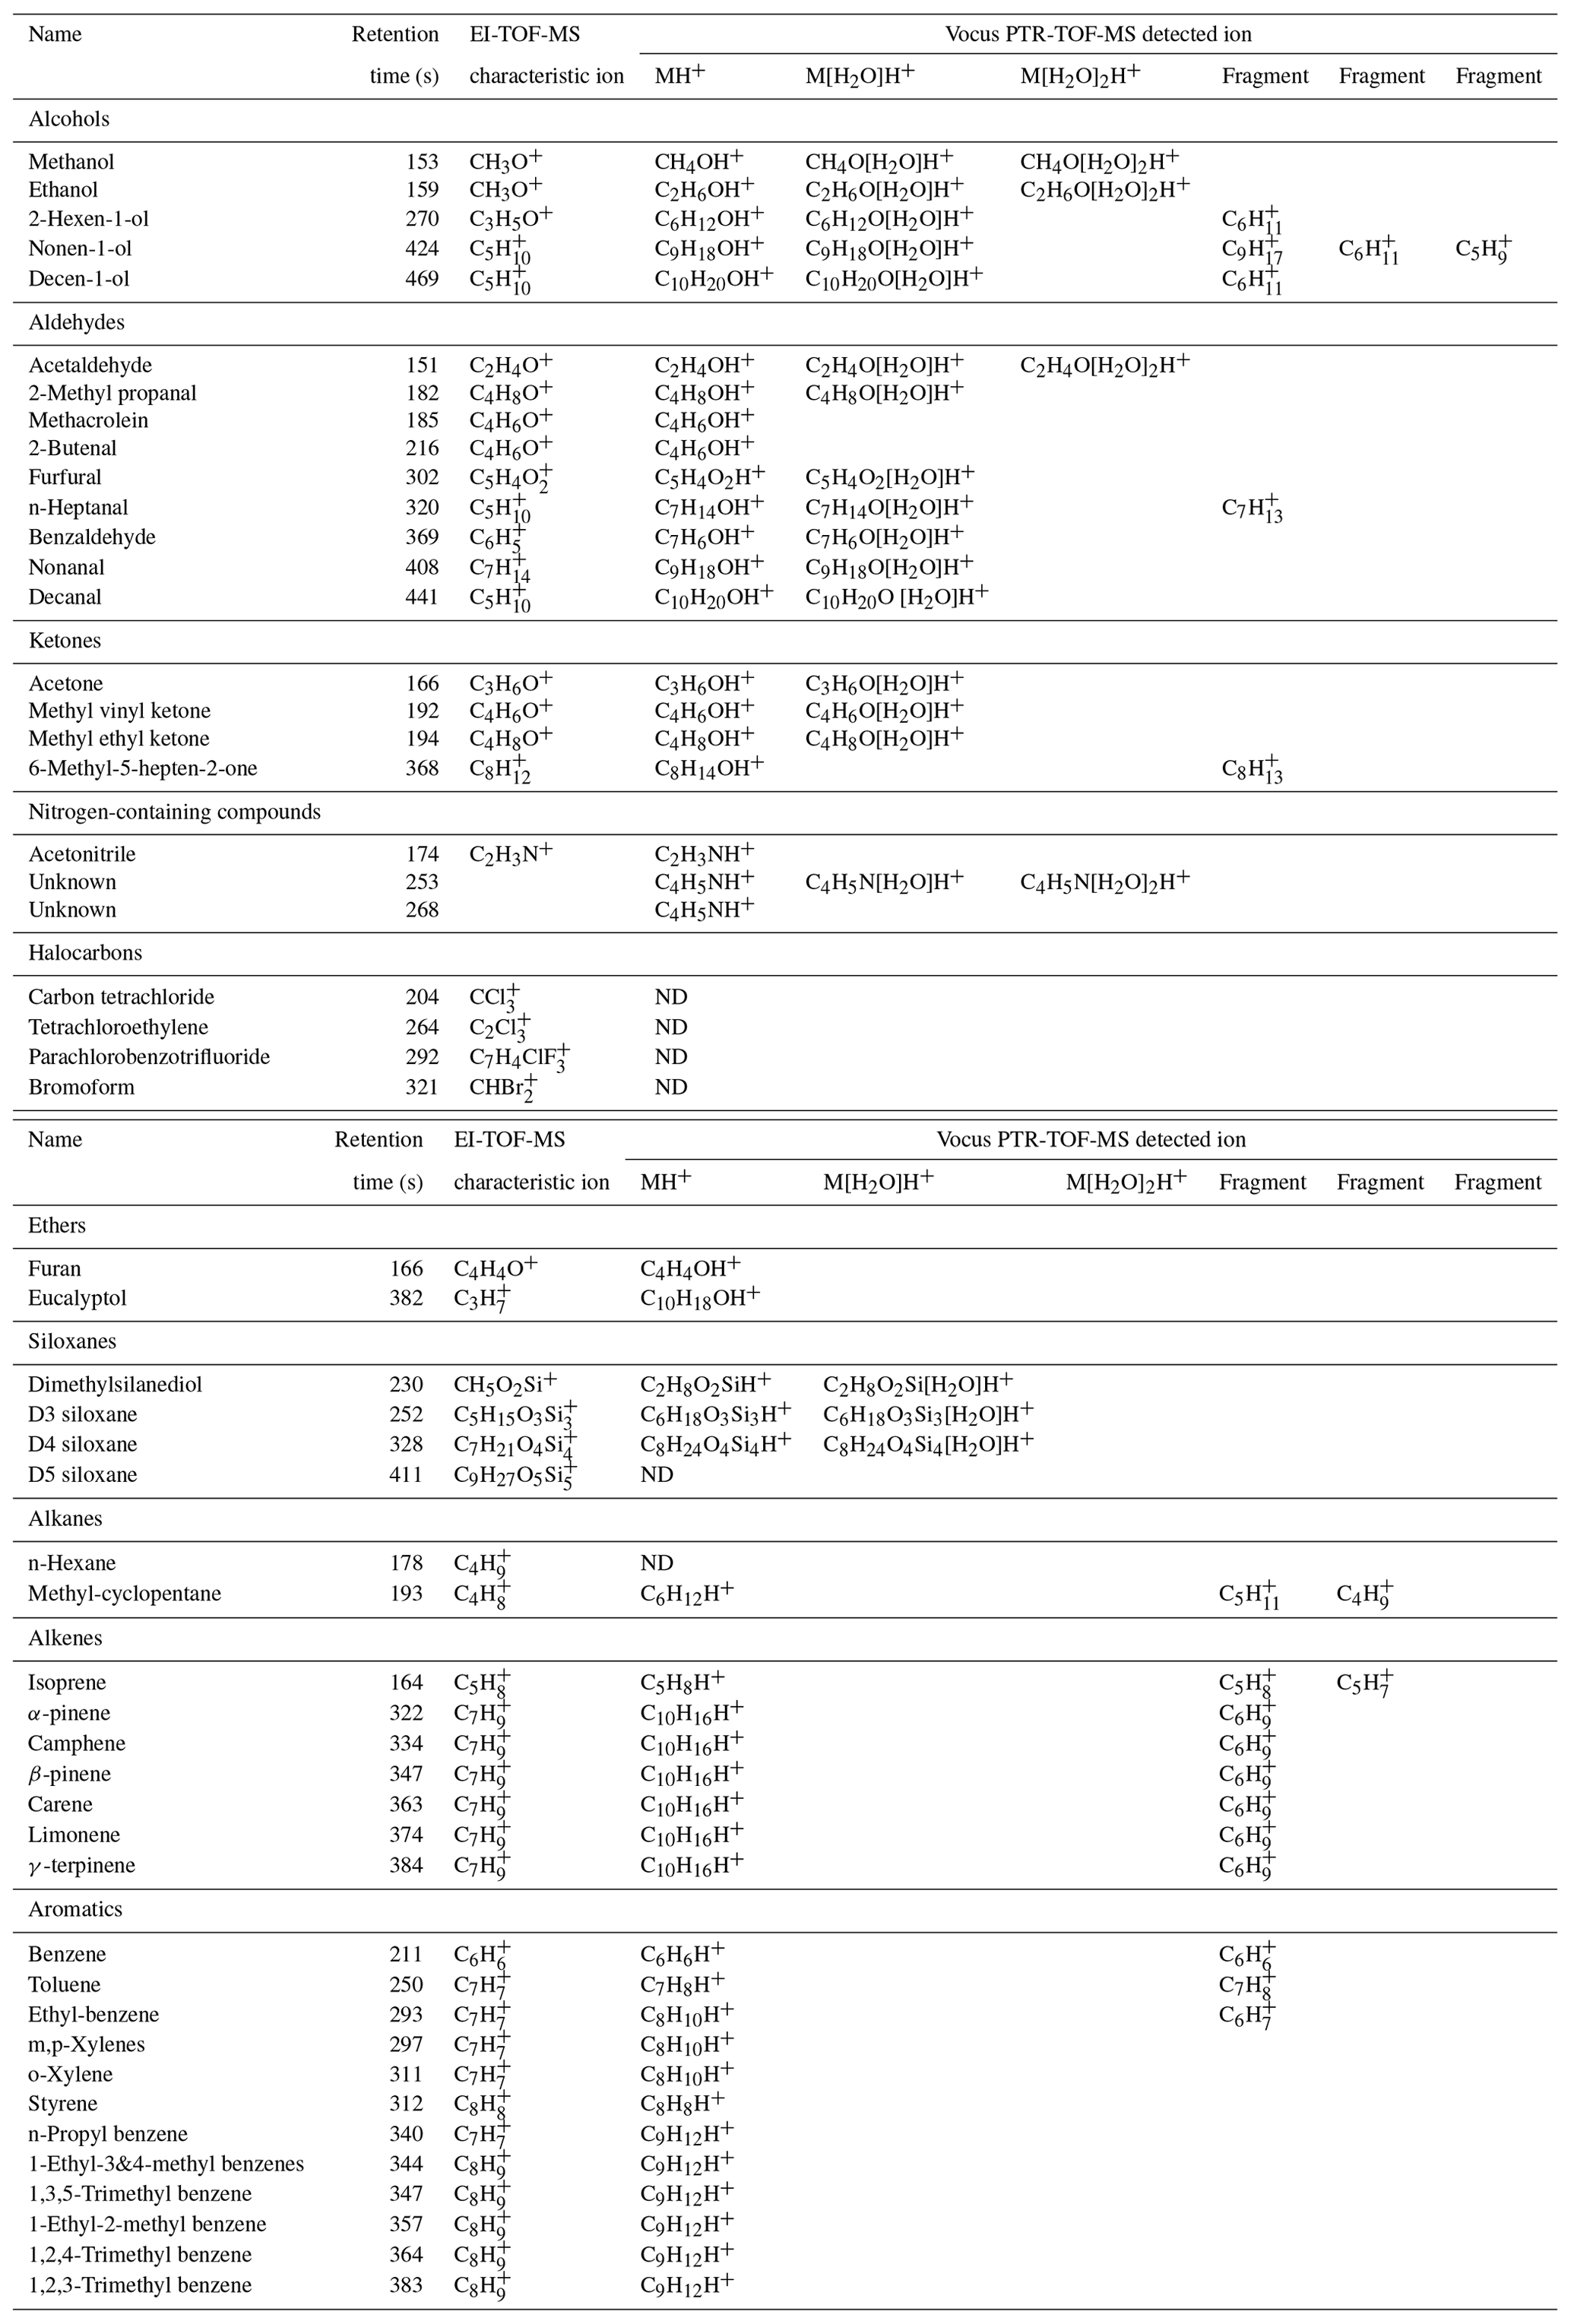
Table 2 presents three types of information about each molecule resolved by the GC: the retention time (which is a function of its vapor pressure, polarity, and functionality) and mass spectrometric response from both the EI-TOF and Vocus. One way to identify compounds is to analyze standards, where each standard compound is injected into the GC to directly measure the analyte retention time and detector response. However, doing this analysis for each compound present in ambient air is time-consuming and may not be feasible as some compounds are not available for purchase as analytical standards. Alternatively, retention time indices along with the mass spectrometric data can be used to confidently identify compounds without authentic standards. For example, a compound that eluted from the GC with retention time 369 s was detected in the Vocus as both C7H6OH+ and C7H8O2H+, which are formulas that could correspond to the protonated molecular ion of either benzaldehyde or methyl-benzenediols, respectively. However, the EI fragmentation pattern of this compound showed large signal at C7H6O+ and C6H, which matches the pattern expected for benzaldehyde (C7H6O+, molecular ion; C6H, due to loss of the aldehyde group). This information is enough to infer that the peak is benzaldehyde and that the ions detected by the Vocus were the protonated molecular ion (C7H6OH+) and its water cluster (C7H6O[H2O]H+). However, this assignment can be made unambiguous by also comparing the retention time and retention index to other compounds present in the chromatogram (Van den Dool and Kratz, 1963; Linstrom and Mallard, 2020, https://webbook.nist.gov/chemistry/, last access: 23 December 2020). The compound retention time of 369 s is between those of o-xylene (311 s) and limonene (374 s), which have retention indices of 890 and 1030, respectively (Linstrom and Mallard, 2020, https://webbook.nist.gov/chemistry/, last access: 23 December 2020). Because benzaldehyde has a retention index of 960, we can predict it would elute between o-xylene and limonene, whereas methyl-benzenediols have retention indices of ≈ 1200, meaning these would elute after limonene. With this method, we can use the combination of mass spectrometric data from the Vocus and the EI-TOF, along with the chromatographic retention time, to definitively identify compounds. Most species were positively identified using the workflow demonstrated for benzaldehyde; however, some compounds were only detected by a single detector. Unsaturated alkanes (e.g., n-hexane) and halocarbons (e.g., carbon tetrachloride, bromoform) were only detected by the EI-TOF, which was expected as these classes of compounds have proton affinities that are too low for detection by PTR-MS methods (Yuan et al., 2017).
Aside from using the GC to aid in compound identification, the GC data can also be used to characterize the ion chemistry occurring in the Vocus. From the information reported in Table 2, it can be seen that classes of compounds showed similar responses in the Vocus (e.g., forming single or double water clusters (M[H2O]H+ or M[H2O]2H+) or undergoing fragmentation). Both results are non-ideal as they complicate the mass spectrum and make quantification and interpretation of the PTR-MS signals more difficult. Alcohols, aldehydes, ketones, siloxanes, and an unknown nitrogen-containing compound all formed significant water clusters within the Vocus ion-molecule reactor, while alkenes and aromatics demonstrated fragmentation. Classes of compounds that were exclusively observed as their protonated molecular ion in the Vocus include ethers, large aromatics (e.g., C9 aromatics), and some nitrogen-containing compounds. The extent to which species form clusters or undergo fragmentation in the PTR-MS is a function of instrument operational parameters like the E∕N ratio (operated here at 150 Td). Although these interferences complicate the RT-Vocus interpretation, with the addition of GC separation the molecular identification and identification of fragment and cluster signals it is possible to perform for complex ambient samples. Furthermore, by using GC separation to quantify the ratio of fragmentation or cluster formation to the protonated molecular ion, the RT-Vocus measurements can be constrained and more easily interpreted.
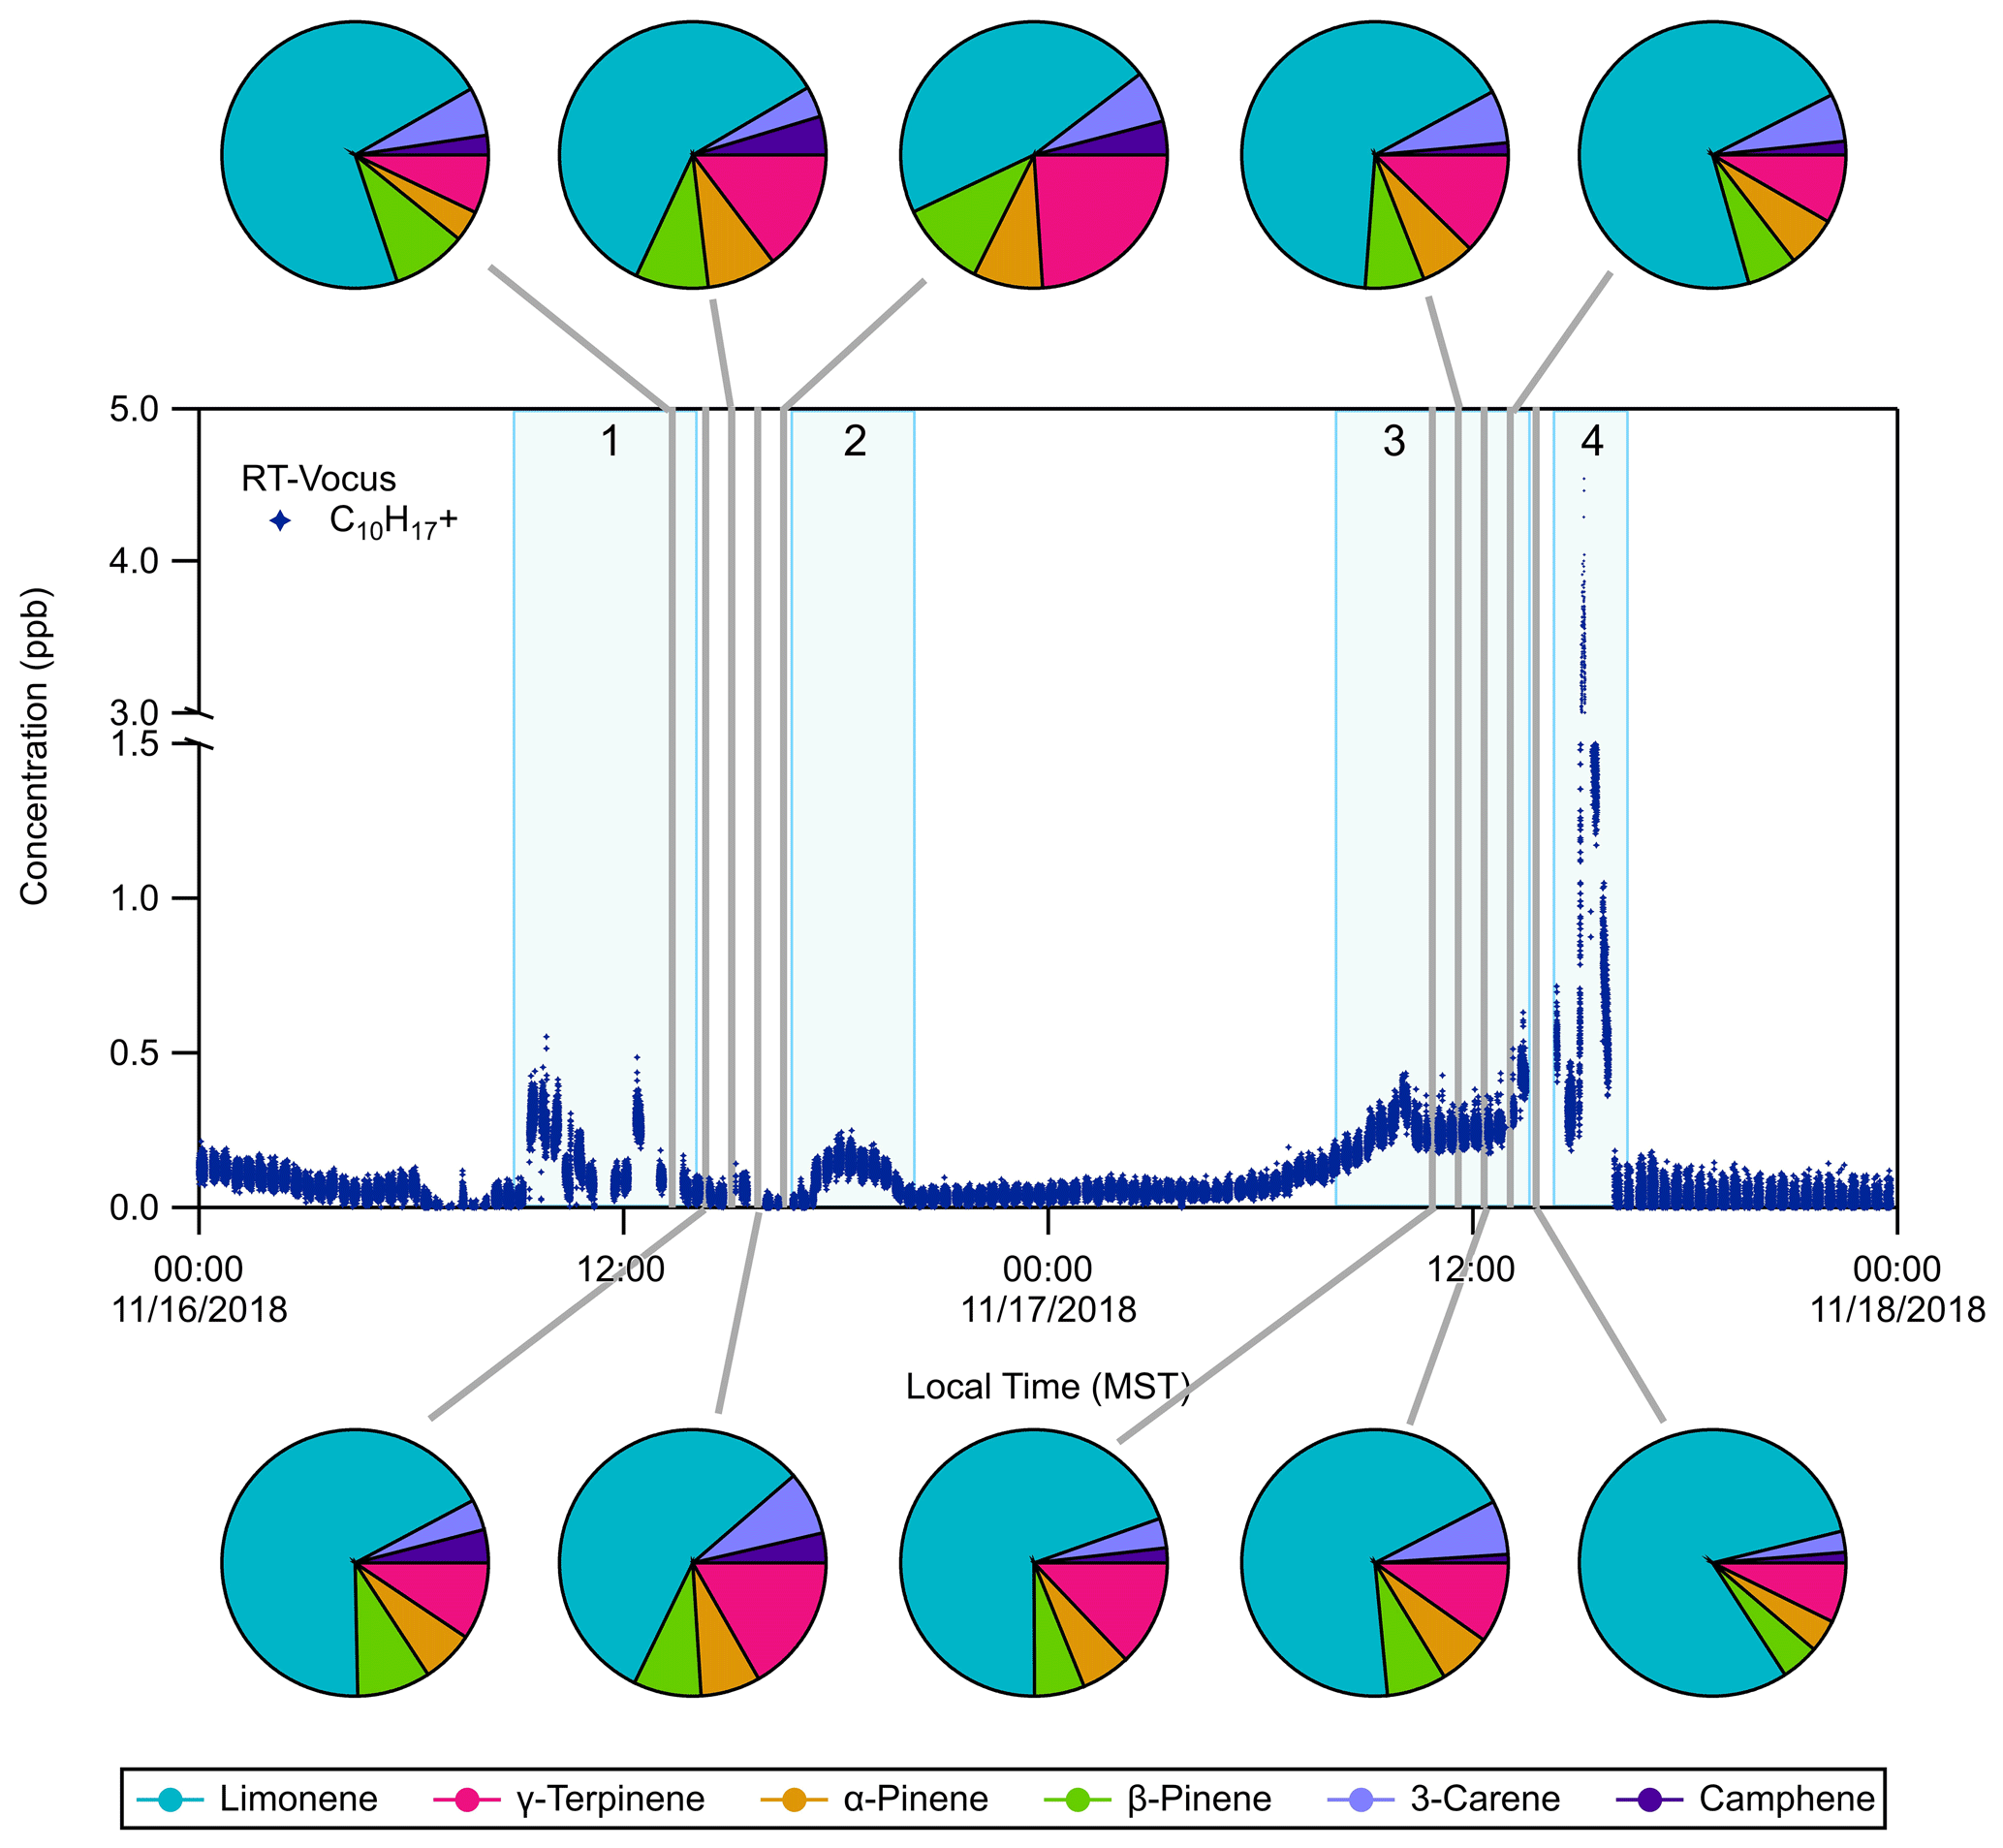
Figure 2RT-Vocus detection of C10H with occasional speciation with GC-Vocus analysis. The RT-Vocus trace only contains room air measurements for simplicity. Pie charts show the GC-Vocus speciation of the RT-Vocus C10H signal into six resolved monoterpene species during each of the highlighted (grey) sampling periods. The pie chart fractions represent the contribution (in concentration, ppb) of each monoterpene isomer to the total monoterpene concentration measured by GC-Vocus. Some specific events are numbered and highlighted in light blue with the following distinctions: (1) exercise session, (2) in flow of outdoor air, (3) football game, and (4) post-game activities.
3.3 Monoterpenes in an indoor environment
3.3.1 Quantitative assessment of monoterpene detection
A subset of the C10H time series, the monoterpene protonated molecular ion measured by RT-Vocus, is shown in Fig. 2. During this period, GC-Vocus and GC-EI-TOF chromatograms were acquired and used to resolve individual monoterpene isomers. The separation of the C10H RT-Vocus signal into six different monoterpenes by the GC-Vocus is shown as pie charts in Fig. 2, where the pie chart fractions represent the contribution of each isomer (by concentration, ppb) to the summed concentration of all monoterpene isomers resolved by the GC-Vocus. As mentioned above, when the GC effluent was not being sent to the Vocus it was directed to the EI-TOF. Figure S4 shows the GC-EI-TOF time series of monoterpenes during the same sampling period shown in Fig. 2. During these sampling periods, limonene accounted for 47 %–80 % of the measured monoterpene composition due to activities occurring in and near the weight room. Details of the temporal behavior are discussed in Sect. 3.3.2.
The RT-Vocus, GC-Vocus, and GC-EI-TOF monoterpene data sets are shown together in Fig. 3. The RT-Vocus C10H signal, along with the speciated monoterpenes (and their sum) resolved by GC-Vocus and GC-EI-TOF, are overlaid in Fig. 3a and b, respectively. The GC-EI-TOF monoterpene sum (Fig. 3b) agrees within a factor of 1.2 on average with the RT-Vocus signal across the entire measurement period. The GC-Vocus monoterpene sum also agrees within a factor of 1.2 with the RT-Vocus signal on 17 November; however, the agreement was not as good (only within a factor of 3) on 16 November. The better agreement on 17 November is due to the monoterpene composition being 70 % limonene on average, which was the isomer used to calibrate the RT-Vocus monoterpene signal.
Previous studies have found that comparing GC speciation with online PTR-MS measurements may result in discrepancies (de Gouw et al., 2003; de Gouw and Warneke, 2007; Kari et al., 2018; Kim et al., 2009). For example, Kari et al. (2018) demonstrated errors of 26 % in PTR-MS ambient measurements when the terpene composition was not accounted for, and instead a calibration factor determined from one isomer was used to represent the mixture. To avoid these errors, they urge PTR-MS users to use complementary methods (e.g., GC) to identify the speciated terpene composition and calibrate the total signal from PTR-MS using this speciation. The findings from Kari et al. (2018) are supported by the results shown here, where the best agreement between the speciated (GC) and online (RT) measurements are when the monoterpene composition is dominated by the isomer that was used to calibrate the RT-Vocus. When the mixture includes significant fractions of multiple isomers, the bias in the RT-Vocus measurement increases. However, if RT-Vocus calibration factors for monoterpenes other than limonene were measured, the RT-Vocus signal could be weighted according to the continuous GC-EI-TOF speciation measurements and corrected for the mixed monoterpene composition.
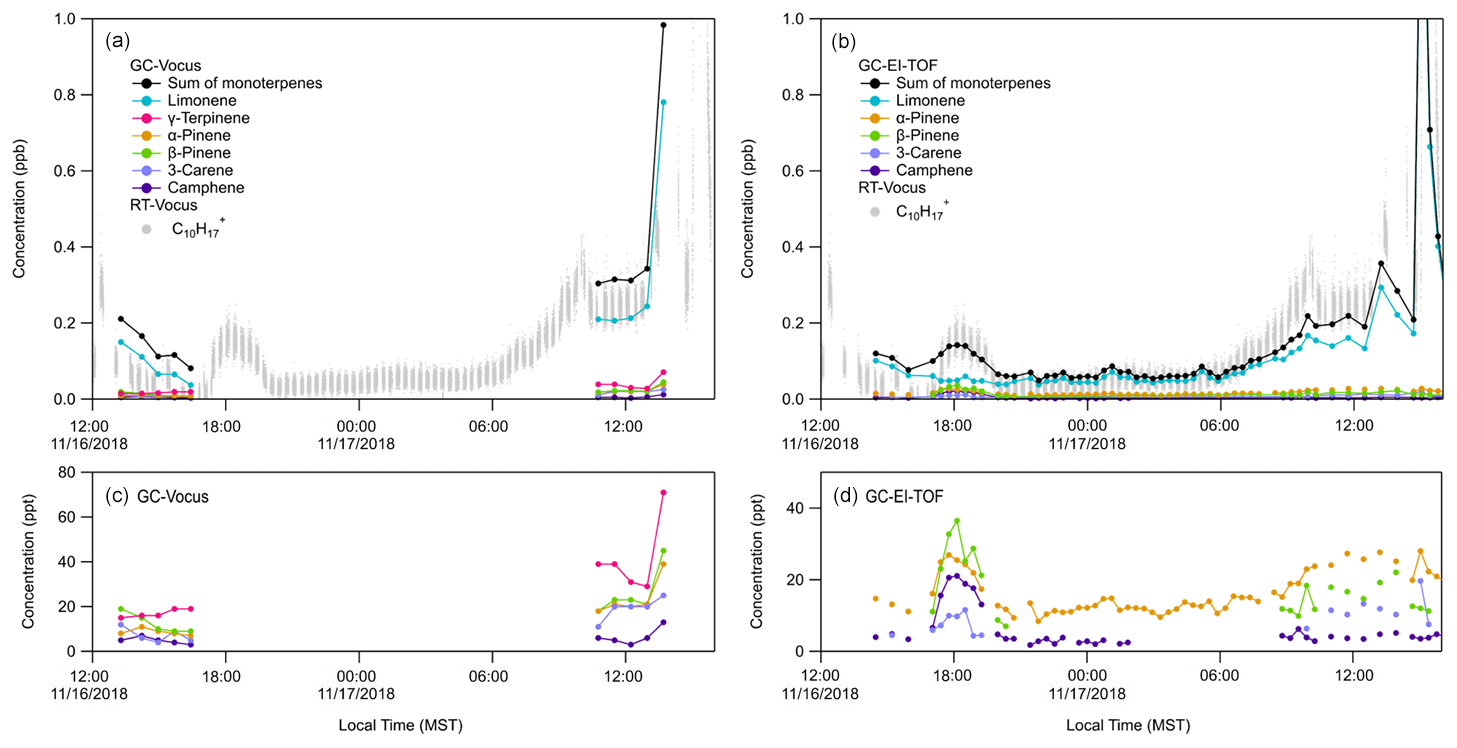
Figure 3Quantitative speciation of RT-Vocus C10H signal (grey trace) into resolved monoterpene isomers by (a) GC-Vocus (b) GC-EI-TOF. Panels (c) and (d) show the same GC-Vocus and GC-EI-TOF time series as in (a) and (b), respectively, but focused on isomers detected at lower concentrations. Absent data points in (d) are for chromatograms where the chromatographic peak area was below the limit of detection. RT-Vocus trace in (a) and (b) only shows RT-Vocus C10H detected in the room (not the supply air) for a direct comparison with the GC samples.
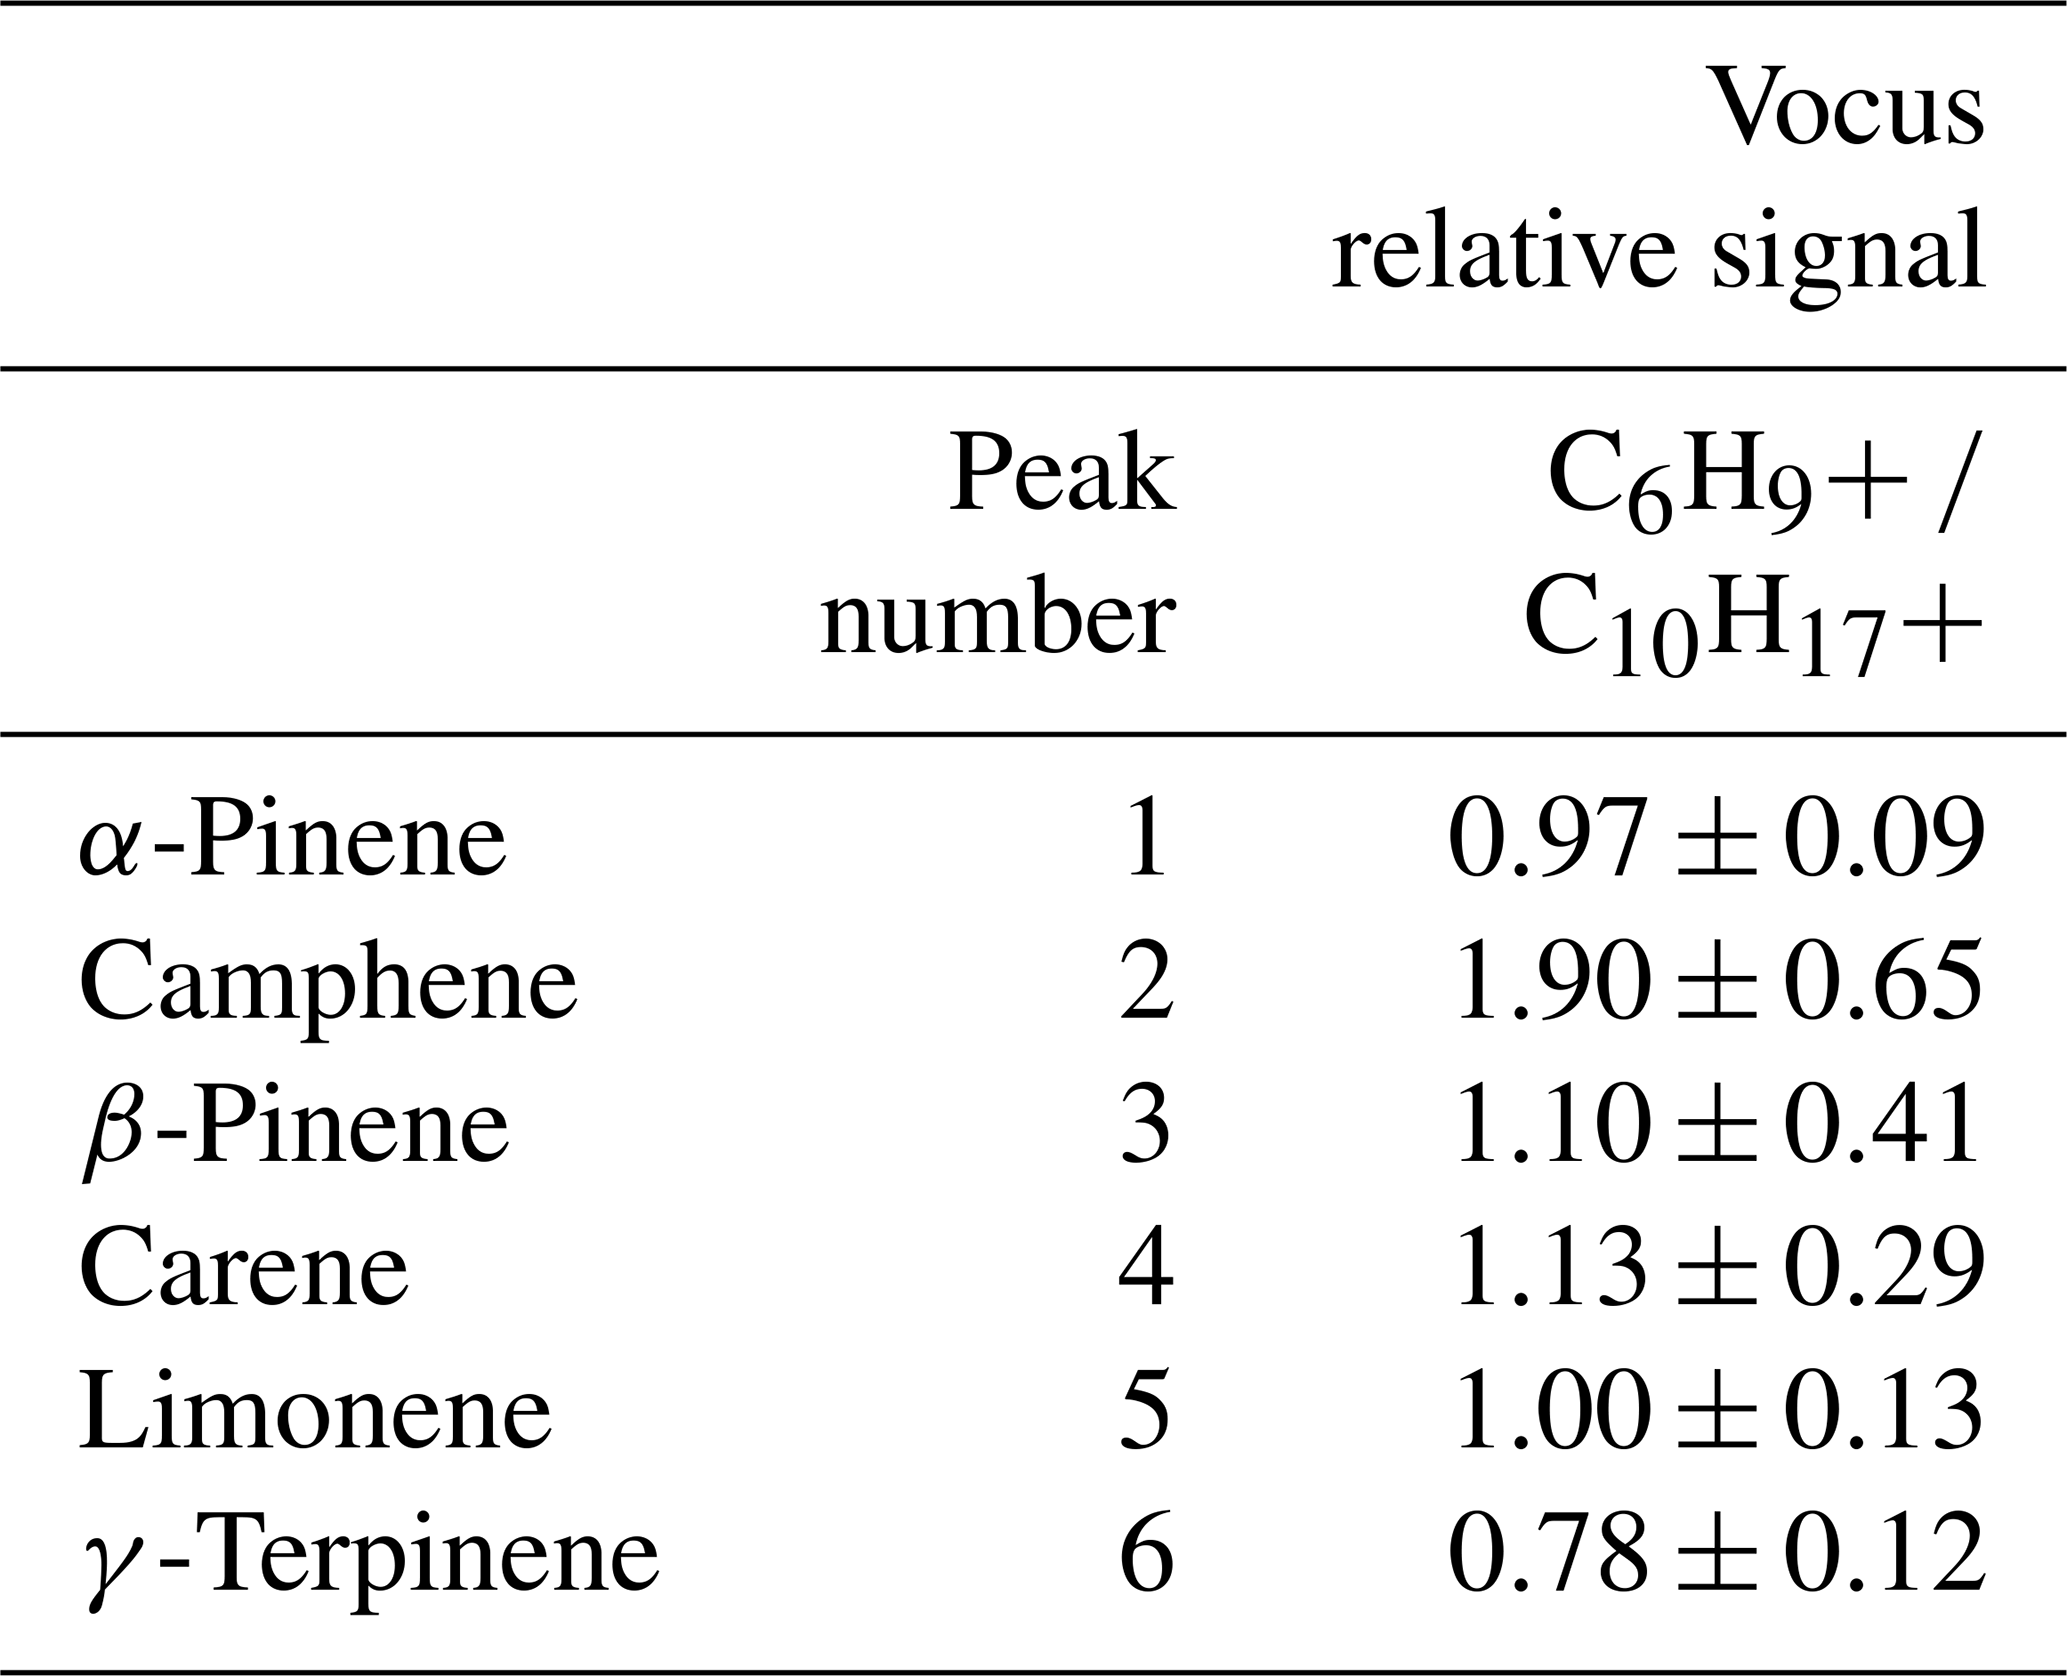
As discussed above, fragmentation and cluster formation can complicate the interpretation of real-time measurements, where now there are multiple ions associated with one compound. An example of this behavior is shown in Figure S5, where Fig. S5a is a GC-Vocus chromatogram of the monoterpene protonated molecular ion, C10H, and Fig. S5b is the chromatogram of C6H, a common monoterpene fragment ion formed in proton-transfer reactions. Relative signals for the fragment ion versus the protonated molecular ions for each monoterpene (labeled 1–6 in Fig. S5a) are reported in Table 3. For all monoterpenes, detection of the fragment ion C6H occurred in approximately a 1:1 ratio to the intact parent ion, C10H.
Specifically, the ratios measured for the isomers ranged from 0.78 to 1.90, with an average of 1.15 ± 0.40; these results are comparable to monoterpene fragmentation ratios reported elsewhere (Steeghs et al., 2007). While the GC can be used to select PTR-MS parameters that optimize the formation of the protonated molecular ion, these other pathways are unavoidable across the range of compound classes observed, and routine GC measurements allow the user to account for them.
3.3.2 Monoterpene temporal behavior during ATHLETIC
During ATHLETIC, several monoterpene enhancement events took place while the system operated in multiple modes. On 16 November, from 09:00 to 12:00 LT (local time), the RT-Vocus measured an increase in the C10H signal in the room air versus the supply air (Fig. 2). This increase correlated with the presence of people in the weight room, who presumably acted as the source of the elevated levels of monoterpenes (likely from personal care products). The GC measurements between 13:00 to 16:30 LT on 16 November were taken while people were present in (and then left) the weight room. During this time the RT-Vocus C10H signal and the limonene measured by GC-Vocus decreased while the other monoterpene isomers stayed relatively constant (Fig. 3a, c). Interestingly, at about 17:00 LT on 16 November, the sum of monoterpenes measured by the GC-EI-TOF showed an increase that was also observed in the RT-Vocus C10H signal (Fig. 3b), and the GC speciation showed that the concentration of all the monoterpene isomers other than limonene increased (Fig. 3d). The increase was first observed by the RT-Vocus in the supply air (Fig. S6A), which, when combined with the GC-EI-TOF identification of non-limonene monoterpenes, allows us to attribute this event to an inflow of outdoor air not influenced by game-related activities.
Table 3Relative signals of ions detected in the Vocus, fragmentation ion (C6H versus protonated molecular ion (C10H, for monoterpene isomers.
An increase on 17 November, between 09:00 and 15:00 LT, occurred during a tailgating event and football game that took place adjacent to the Dal Ward Athletic Center. During this event, the room air and the supply air both showed increased C10H signals (Fig. S6B) indicating a source in close proximity to the facility. Since the supply air for the weight room enters the building from an intake on the north side of the football stadium, VOCs emitted during the sporting event could be subsequently transported through the HVAC system and into the weight room. The large spike in C10H observed that day at 15:00 LT, however, was predominantly measured inside the weight room rather than in the supply air (Fig. S6C), suggesting an emission source in the room associated with people and possibly cleaning activities in the Dal Ward center after the game. Evaluating the 17 November enhancement events with the GC measurements, it is clear that the increase in the RT-Vocus C10H signal during the football game and the spike that occurred at 15:00 LT were due to an increase in limonene (Fig. 3a, b), with no corresponding significant increases in the other monoterpene isomers (Fig. 3c, d). The large monoterpene enhancement observed during and after the football game, which was dominated by limonene, was likely due to VCPs from personal care products used by the athletes and spectators and/or cleaning supplies.
3.3.3 Anthropogenic signature of monoterpenes
Indoor environments generally have relatively low oxidant and high VOC concentrations compared to the ambient atmosphere (Pagonis et al., 2019; Price et al., 2019). As a result, the fraction of monoterpenes that are oxidized indoors is small, and to a large extent they are transported outdoors. The monoterpene composition measured in this study provides anthropogenic source signatures that differ from those associated with typical outdoor biogenic sources (Guenther et al., 2012). These source signatures were compared using three ratios: limonene/α-pinene (lim/αp), limonene/β-pinene (lim/βp), and α-pinene/β-pinene (αp/βp). Generally, these ratios are a function of their emission profiles either from plant species outdoors, VCPs from human activity indoors, and a mixture of these sources in urban areas. Geron et al. (2000) reports monoterpene compositions for forested regions in the United States, which give the following averages for these ratios (average ± standard deviation): lim/αp = 0.32 ± 0.21, lim/βp = 0.56 ± 0.46, and αp/βp = 1.63 ± 0.70. These values reflect the emission profiles from the types of plants in the forest and agree very well with those of Faiola et al. (2015), where the average ratios determined from emissions from coniferous plants (e.g., blue spruce, grand fir, bristlecone pine) were lim/αp = 0.29 ± 0.16, lim/βp = 0.73 ± 1.16, and αp/βp = 2.18 ± 2.28. These studies show that when the source of the monoterpenes is biogenic, α- and β-pinene emissions dominate over limonene, and α-pinene emissions are about twice those of β-pinene. For comparison, the average ratios measured by GC-EI-TOF during ATHLETIC were lim/αp = 4.67 ± 4.97 (maximum 56.4, minimum 1.62), lim/βp = 8.66 ± 16.1 (maximum 131, minimum 1.36), and αp/βp = 1.73 ± 0.61 (maximum 3.93, minimum 0.70). The large standard deviations of the limonene to α- and β-pinene ratios are due to the large limonene emission event after the football game on 17 November. Unlike the biogenic ratios described above, the results from the indoor environment show that limonene emissions always dominate over α- and β-pinene emissions, although the magnitude is highly variable and depends on proximity to sources (like the application of cleaning or personal care products). The αp ∕ βp ratio measured during ATHLETIC is indicative of biogenic sources, consistent with our attribution of these isomers in the weight room to transport by outdoor air, where their source was likely biogenic. This shift in dominance from isomers like α- and β-pinene to limonene can have important implications on ambient air quality due to differences in reactivity (Atkinson and Arey, 2003) and secondary organic aerosol (SOA) formation potential (Lee et al., 2006).
3.4 Detection of dimethylsilanediol
In the GC-EI-TOF chromatograms, a well-resolved peak was observed at retention time 230 s (Fig. S7A) with a mass spectrum base peak at m∕z 77 (Fig. S8A). Using TERN analysis software, the unit mass resolution (UMR) electron ionization fragmentation pattern for this chromatographic peak (Fig. S8) was compared against the NIST mass spectral database (Linstrom and Mallard, 2020, https://webbook.nist.gov/chemistry/, last access: 23 December 2020) resulting (90.8 % probability) in an identification of that compound as dimethylsilanediol (DMSD). Analyzing the same chromatographic peak with the high-resolution EI-TOF data, the mass spectral peak at UMR m∕z 77 was assigned as molecular formula CH5O2Si+ (Fig. S9A). This characteristic ion is formed from DMSD through the loss of a methyl (CH3) group. The protonated molecular ion of DMSD (C2H8O2SiH+) and its protonated water cluster (C2H8O2Si[H2O]H+) were identified at the same retention time in the GC-Vocus chromatogram (Fig. S7B). The tailing observed only in the GC-Vocus chromatographic peak was likely from inefficient transport through the transfer line due to non-uniform heating. The high-resolution mass spectral fits for these peaks from the GC-Vocus are shown in Fig. S9B and C, respectively. From the high-resolution identification of the molecular ion (GC-Vocus) and the fragmentation pattern with characteristic ions (GC-EI-TOF), this compound was conclusively identified as DMSD.
It should be recognized that siloxanes have historically been a class of compounds that are difficult to measure analytically due to artifacts created throughout sampling systems (Rücker and Kümmerer, 2015). For example, siloxanes have been associated with artifacts for GC analyses that utilize septa in the sample path (de Zeeuw, 2005; Wang, 2006). For the instrument used in this study, no septa are present, and with our in situ GC sampling we avoid many artifacts that can be introduced due to sample collection and storage for offline analysis. The sample trap used for preconcentration is also of concern for artifact generation. To determine if DMSD is being produced as an artifact from the adsorbent trap, we conducted system zeros using dry (RH < 2 %) and humidified (RH ≈ 50 %) UHP N2 to cover humidity conditions relevant for this study and saw no evidence of DMSD. From these results, we conclude that the DMSD observed during this study was not an artifact of the instrumentation but was instead present in the air sampled from the weight room.
Figure 4 shows the time series of the integrated chromatographic peak areas detected from the GC-EI-TOF. The time series shows dynamic behavior where DMSD builds up in the room starting at midnight on 17 November until a sharp decay after the football game, as seen with the RT-Vocus C10H signal (Fig. 2) and the GC-EI-TOF limonene signal (Fig. S4a).
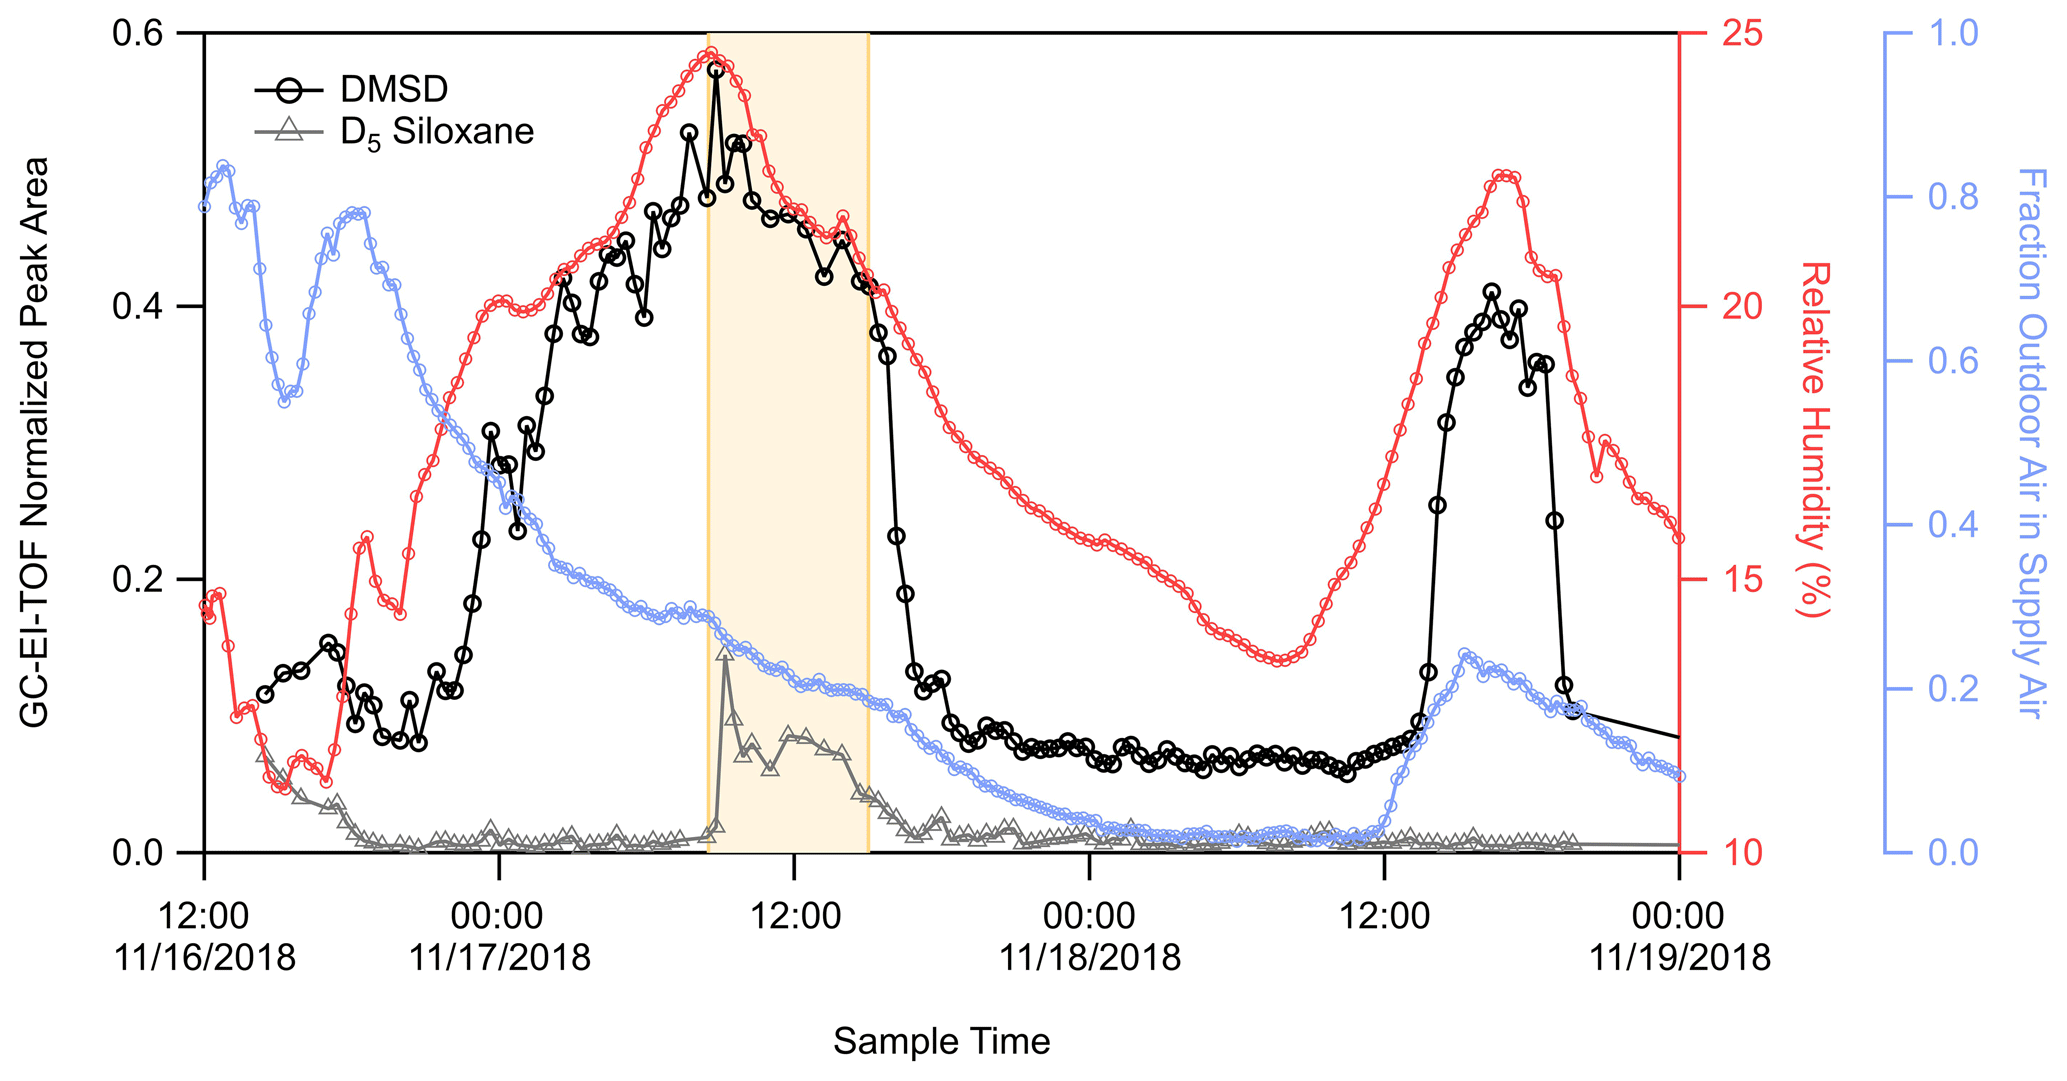
Figure 4Time series of DMSD (black trace) and D5 siloxane (grey trace) detected by GC-EI-TOF (normalized counts, ncts), weight room relative humidity (pink trace), and the fraction of outside air in the room supply air (blue trace). The area highlighted in yellow represents the time during which pre-game activities and a football game were occurring adjacent to the athletic center.
This elevated concentration of DMSD on 17 November is also observed in the more limited GC-Vocus data set where only 10 chromatograms were obtained. As shown in Fig. S9, DMSD was detected as both the protonated molecular ion (C2H8O2SiH+) and as the protonated water cluster of the molecular ion (C2H8O2Si[H2O]H+). After the decay on 17 November, the DMSD stabilizes to a background concentration until another increase in concentration starting in early afternoon on 18 November. The temporal behavior follows that of the RH in the room (Fig. 4), where DMSD begins to increase following an increase in RH and then declines sharply as the RH begins to decrease. Figure 4 shows that during the first DMSD enhancement, the fraction of outside air in the supply air was tapering down from 40 % to 15 %; however, during the enhancement on 18 November, outside air was increasing from near 0% to about 20 %. The lack of correlation between DMSD and the fraction of outdoor air in the supply air indicates that this compound was not being transported from outdoors but instead had a source inside the room or building. The sharp decrease in DMSD, which correlated with the observed decay for limonene on 17 November, appears to be from reduced production of DMSD in the room, along with a fast loss from ventilation. The observed behavior of DMSD does not follow that of decamethylcyclopentasiloxane (D5), a siloxane commonly used in personal care products like deodorants (Coggon et al., 2018; Tang et al., 2015). The time trace for D5 is also shown in Fig. 4. There is an enhancement in the D5 signal during the football game and associated activities on 17 November (due to people inside and adjacent to the weight room), but the D5 time series does not track the initial buildup of DMSD on 17 November and shows no enhancement during the DMSD pulse on 18 November. Therefore, it is apparent that there are different sources for these two organosiloxane compounds.
DMSD has been shown to be an environmental degradation product of both cyclic (cVMS) and linear (PDMS) siloxanes (Rücker and Kümmerer, 2015; Tuazon et al., 2000). Both classes of organosiloxanes degrade to DMSD through gas-phase oxidation by hydroxyl (OH) radicals (Tuazon et al., 2000) and through condensed-phase hydrolysis reactions (Xu et al., 1998; Lehmann et al., 1994a,b; Lehmann et al., 1995; Carpenter et al., 1995). While there is uncertainty surrounding the importance of OH radical chemistry indoors, previous work has estimated that typical indoor OH radical concentrations are on the order of 105 molec. cm−3 due to low lighting conditions that reduce conventional photolysis reactions that produce OH radicals (Weschler and Carslaw, 2018; Abbatt and Wang, 2020; Pagonis et al., 2019; Gligorovski and Weschler, 2013; Young et al., 2019). In the weight room during the DMSD enhancement events there was no natural light (i.e., no windows in the room) and little artificial light as the space was often unoccupied. In addition, as discussed above and shown in Fig. 4, DMSD enhancement events do not track the observed behavior of D5 siloxane. For these reasons, we conclude that the DMSD observed in this study was not formed inside through gas-phase oxidation of cVMSs (e.g., D5 siloxane) by OH radicals, and instead we hypothesize that the production is through condensed-phase reactions followed by volatilization.
The mechanism by which PDMS (the less volatile class of organosiloxanes) decompose to form DMSD has primarily been studied with regards to degradation in soils. There, PDMS undergoes moisture-dependent hydrolysis to form DMSD, a process shown to be catalyzed by minerals present in clay (Xu et al., 1998). Figure 5 provides a proposed mechanism for the formation of DMSD from PDMS, though note that the PDMS co-product of DMSD can also undergo hydrolysis to produce more DMSD.
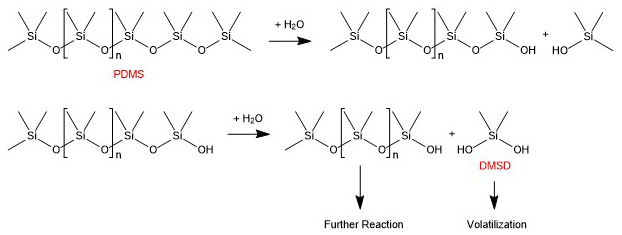
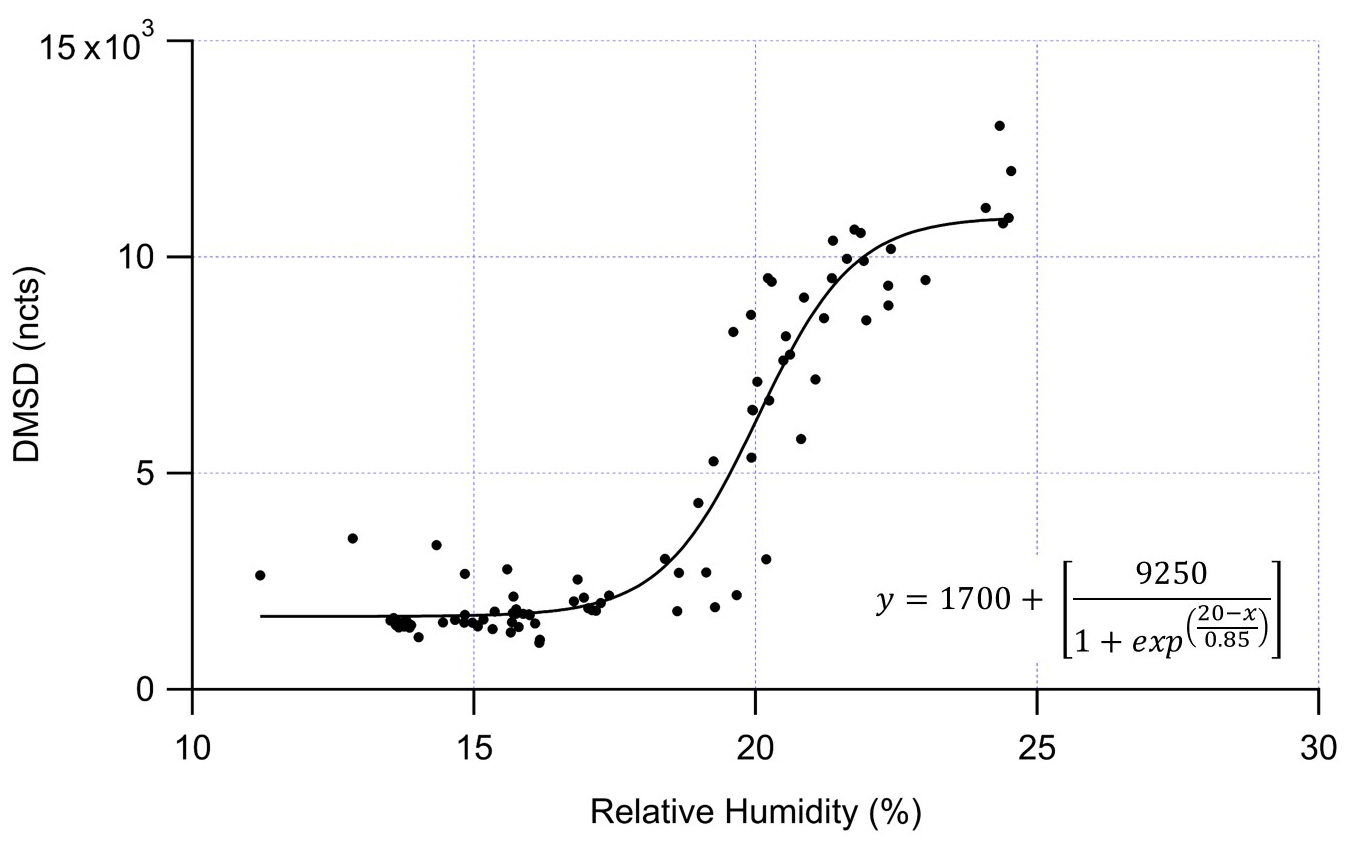
Figure 6DMSD (normalized counts, ncts) measured by the GC-EI-TOF versus relative humidity (%). The data was fit with a sigmoidal curve that shows the greatest rate of change in DMSD production at ≈ 20 % RH.
Once formed, the DMSD then either volatilizes or is retained in the condensed phase to undergo subsequent reactions. Depending on the moisture conditions and mineral composition, hydrolysis occurs on timescales of minutes to days and efficiently in the presence of calcified minerals like Ca-kaolinite, Ca-beidellite, and Ca-nontronite (Xu et al., 1998). The hydrolysis of PDMS to DMSD has been shown to only occur in the presence of moderate amounts of water (Rücker and Kümmerer, 2015; Lehmann et al., 1998). Some water is required for the hydrolysis reaction, but when moisture levels are too high the reaction shuts off, presumably due to saturation of catalytic mineral sites by adsorbed water.
While the exact source of DMSD observed during this study cannot be determined from our measurements, we can suggest at least two possible sources for the DMSD production that would account for our observations. As shown in Fig. 6, the DMSD signal has a sigmoidal relationship with RH, where the greatest rate of change in DMSD production is around 20 % RH. The steepness of the curve suggests the DMSD is being produced from a discrete process, likely due to some material that combines siloxanes with a mineral catalyst taking up water around 20 % RH providing the needed water for the hydrolysis reaction.
Indoors, sources of PDMS are numerous: paints, coatings, sealants, textiles, and electronics (Andriot et al., 2007). Particularly relevant is their use in paints, where PDMS are used as the binder (30 % w∕w–100 % w∕w of the mixture) and as additives (0.1 % w∕w–5 % w∕w of the mixture), depending on the product and manufacturer (Andriot et al., 2007). Another significant component of paints are inorganic minerals, used as pigments and extenders, constituting 20 %–50 % of the paint mixture (Karakaş et al., 2010). While TiO2 is commonly added for its optical properties, minerals like calcite, Ca-kaolin, talc, and dolomite are used as fillers (Karakaş et al., 2011). The abundance of painted surfaces indoors and the correlation between room humidity and enhancement of DMSD (Fig. 4) provide a possible explanation for the observation of DMSD during this study: mineral-catalyzed hydrolysis of PDMS on painted surfaces analogous to what occurs in soils. While the presence of PDMS in paints and coatings makes this chemistry plausible, the partitioning of lower-volatility cVMS could also act as a source of condensed-phase siloxanes in indoor environments. Using the D5 siloxane vapor pressure measured by Lei et al. (2010), the saturation vapor concentration (C*) is estimated to be ≈ 106 µg m−3. According to Pagonis et al. (2019) and Algrim et al. (2020), for compounds with µg m−3 deposition to surfaces can compete with ventilation as a removal process. Thus, some of the cVMS emitted in the weight room may partition to surfaces where they could react to produce DMSD as discussed above for PDMS.
The observation of DMSD as an atmospheric reaction product of cVMS, as a soil degradation product of PDMS, and now in an indoor environment where its formation is proposed to occur by surface hydrolysis of siloxanes, demonstrates the need to quantify its environmental impact. A review by Rücker and Kümmerer (2015) refers to DMSD as the most important intermediate of organosiloxanes degradation, and yet very little is known about its physical properties, even boiling point or vapor pressure. This lack of knowledge has been due in part to an absence of analytical methods that can measure these compounds. Here, we have demonstrated an in situ, field-deployable technique capable of measuring DMSD that can be used in a wide variety of environments to understand the sources and fates of this compound. These measurements are of particular interest considering that the eventual fate of DMSD in the atmosphere is to form CO2 and SiO2, where SiO2 could contribute to new particle formation and growth in the atmosphere (Bzdek et al., 2014).
In this study we present a field-deployable in situ GC with thermal desorption preconcentration and automatic switching between two time-of-flight mass spectrometric detectors, Vocus PTR-TOF-MS and EI-TOF-MS. We have demonstrated how this novel technique generates three complementary data sets: RT-Vocus for fast, non-speciated, detection of VOCs and molecular identification with both GC-Vocus and GC-EI-TOF. The latter provide molecular ion and electron ionization fragmentation pattern information, respectively, for each compound resolved by the GC. Unambiguous molecular identification is obtained with the combination of these three techniques and the molecular speciation from the GC methods can be used to aid interpretation of complex real-time PTR-MS measurements, where fragmentation and the formation of clusters can complicate analysis. By including the GC with thermal desorption preconcentration, Vocus sensitivities were increased by a factor of 50 on average over the real-time measurements that were acquired with 1 Hz time resolution, and both GC-TOF methods demonstrated LODs of 1.6 ppt on average across a range of monoterpenes and aromatics.
To demonstrate this technique, the prototype GC-TOF-MS system was deployed during the 2018 ATHLETIC campaign at the University of Colorado Dal Ward Athletic Center to characterize VOC profiles with detailed speciation and high time resolution. The results presented report the identification of a wide range of VOCs, including hydrocarbons, oxygenates, and nitrogen-containing compounds and their responses in each TOF-MS detector. Two sets of notable results from the GC-TOF-MS system are described in detail, including the quantification of speciated anthropogenic monoterpenes, where the composition is dominated (47 %–80 %) by limonene due to the use of personal care products and cleaning supplies in the indoor environment. Furthermore, the detection of DMSD, hypothesized to be due to the heterogenous hydrolysis of siloxanes on painted surfaces, demonstrates this technique's ability to detect new processes due to its ability to be field deployed with in situ sampling, high time resolution measurements, and high-resolution mass spectrometric detection, which provides molecular formulas to aid interpretation.
Further development including flow path optimization, expanding the volatility range of resolved VOCs, and increasing system sensitivities by preconcentrating larger sample volumes using multi-stage sample trapping is underway. Increased instrument sensitivity and decreased limits of detection scale with larger sample volumes, and while the simplified TDPC used here had limitations in sampling rate and volume, we have recently developed a two-stage TDPC that improves upon these parameters and can collect large volumes (1 L typical) in 10 min or less. Although the instrument presented here was a prototype system, the results reported demonstrate that this is a valuable analytical tool that should be deployed in future field campaigns and laboratory experiments to characterize VOC emissions and their reaction products in new and changing environments.
All data collected during the ATHLETIC campaign are archived on the de Gouw and Jimenez servers at the University of Colorado at Boulder. Data are available upon request.
The supplement related to this article is available online at: https://doi.org/10.5194/amt-14-133-2021-supplement.
MSC and BML built the ARI GC designed by BML and JTJ. The ATHLETIC campaign was designed by PJZ, JLJ, and JdG. Instrument operation during ATHLETIC was performed as follows: GC-TOF-MS by MSC, Vocus PTR-TOF-MS by DP, and Piccaro by AVH and DAD. Data analysis was performed as follows: GC-TOF-MS by MSC, RT-Vocus by ZF, Piccaro by AVH and DAD, and temperature and air handling by WLB. MSC prepared the manuscript with contributions from all co-authors.
The authors declare that they have no conflict of interest.
The authors acknowledge Jason DePaepe, Shawn Herrera, Mary Therese Eisner, Jennifer Green, and Jeremy Johnson at the University of Colorado – Athletics and Facilities for hosting and supporting this study. WLB acknowledges support from a CIRES Graduate Fellowship.
The ATHLETIC study and subsequent research activities were supported by the Alfred P. Sloan Foundation (grant nos. G-2016-7173 and G-2019-12444).
This paper was edited by Hendrik Fuchs and reviewed by two anonymous referees.
Abbatt, J. P. D. and Wang, C.: The atmospheric chemistry of indoor environments, Environ. Sci. Process. Impacts, 22, 25–48, https://doi.org/10.1039/c9em00386j, 2020.
Algrim, L. B., Pagonis, D., de Gouw, J. A., Jimenez, J. L., and Ziemann, P. J.: Measurements and modeling of absorptive partitioning of volatile organic compounds to painted surfaces, Indoor Air, 30, 745–756, https://doi.org/10.1111/ina.12654, 2020.
Anderson, D. C., Pavelec, J., Daube, C., Herndon, S. C., Knighton, W. B., Lerner, B. M., Roscioli, J. R., Yacovitch, T. I., and Wood, E. C.: Characterization of ozone production in San Antonio, Texas, using measurements of total peroxy radicals, Atmos. Chem. Phys., 19, 2845–2860, https://doi.org/10.5194/acp-19-2845-2019, 2019.
Andriot, M., Chao, S., Colas, A., Cray, S., DeBuyl, F., DeGroot, J., Dupont, A., Easton, T., Garaud, J., and Gerlach, E.: Silicones in industrial applications, Inorganic polymers, edited by: De Jaeger, R. and Gleria, M., Nova Sciences, Hauppauge, New York, USA, 61–161, 2007.
Atkinson, R. and Arey, J.: Atmospheric degradation of volatile organic compounds, Chem. Rev., 103, 4605–4638, https://doi.org/10.1021/cr0206420, 2003.
Bzdek, B. R., Horan, A. J., Pennington, M. R., Janechek, N. J., Baek, J., Stanier, C. O., and Johnston, M. V.: Silicon is a frequent component of atmospheric nanoparticles, Environ. Sci. Technol., 48, 11137–11145, https://doi.org/10.1021/es5026933, 2014.
Cappellin, L., Karl, T., Probst, M., Ismailova, O., Winkler, P. M., Soukoulis, C., Aprea, E., Mark, T. D., Gasperi, F., and Biasioli, F.: On quantitative determination of volatile organic compound concentrations using proton transfer reaction time-of-flight mass spectrometry, Environ. Sci. Technol., 46, 2283–2290, https://doi.org/10.1021/es203985t, 2012.
Carpenter, J. C., Cella, J. A., and Dorn, S. B.: Study of the degradation of polydimethylsiloxanes on soil, Environ. Sci. Technol., 29, 864–868, https://doi.org/10.1021/es00004a005, 1995.
Coggon, M. M., McDonald, B. C., Vlasenko, A., Veres, P. R., Bernard, F., Koss, A. R., Yuan, B., Gilman, J. B., Peischl, J., Aikin, K. C., DuRant, J., Warneke, C., Li, S.-M., and de Gouw, J. A.: Diurnal variability and emission pattern of decamethylcyclopentasiloxane (D5) from the application of personal care products in two North American cities, Environ. Sci. Technol., 52, 5610–5618, https://doi.org/10.1021/acs.est.8b00506, 2018.
de Gouw, J. and Warneke, C.: Measurements of volatile organic compounds in the earth's atmosphere using proton-transfer-reaction mass spectrometry, Mass Spectrom. Rev., 26, 223–257, https://doi.org/10.1002/mas.20119, 2007.
de Gouw, J., Goldan, P., Warneke, C., Kuster, W., Roberts, J., Marchewka, M., Bertman, S., Pszenny, A., and Keene, W.: Validation of proton transfer reaction-mass spectrometry (PTR-MS) measurements of gas-phase organic compounds in the atmosphere during the New England Air Quality Study (NEAQS) in 2002, J. Geophys. Res.-Atmos., 108, 4682, https://doi.org/10.1029/2003JD003863, 2003.
de Zeeuw, J.: How to minimize septum problems in GC, Am. Lab., 37, 18–20, 2005.
Faiola, C. L., Jobson, B. T., and VanReken, T. M.: Impacts of simulated herbivory on volatile organic compound emission profiles from coniferous plants, Biogeosciences, 12, 527–547, https://doi.org/10.5194/bg-12-527-2015, 2015.
Farmer, D. K., Vance, M. E., Abbatt, J. P., Abeleira, A., Alves, M. R., Arata, C., Boedicker, E., Bourne, S., Cardoso-Saldaña, F., Corsi, R., DeCarlo, P. F., Goldstein, A. H., Grassian, V. H., Hildebrandt Ruiz, L., Jimenez, J. L., Kahan, T. F., Katz, E. F., Mattila, J. M., Nazaroff, W. W., Novoselac, A., O-Brian, R. E., Or, V. W., Patel, S., Sankhyan, S., Stevens, P. S., Tian, Y., Wade, M., Wang, C., Zhou, S., and Zhou, Y.: Overview of HOMEChem: House observations of microbial and environmental chemistry, Environ. Sci. Process. Impacts, 21, 1280–1300, https://doi.org/10.1039/C9EM00228F, 2019.
Finewax, Z., Pagonis, D., Claflin, M. S., Handschy, A. V., Brown, W., Jenks, O., Nault, B. A., Day, D. A., Lerner, B. M., Jimenez, J. L., Ziemann, P. J., and de Gouw, J. A.: Quantification and source characterization of volatile organic compounds from exercising and application of chlorine-based cleaning products in a university athletic center, Indoor Air, https://doi.org/10.1111/ina.12781, early view, 2020.
Gallagher, M., Wysocki, C. J., Leyden, J. J., Spielman, A., Sun, X., and Preti, G.: Analyses of volatile organic compounds from human skin, Br. J. Dermatol., 159, 780–791, https://doi.org/10.1111/j.1365-2133.2008.08748.x, 2008.
Gentner, D. R., Jathar, S. H., Gordon, T. D., Bahreini, R., Day, D. A., El Haddad, I., Hayes, P. L., Pieber, S. M., Platt, S. M., and de Gouw, J.: Review of urban secondary organic aerosol formation from gasoline and diesel motor vehicle emissions, Environ. Sci. Technol., 51, 1074–1093, https://doi.org/10.1021/acs.est.6b04509, 2017.
Geron, C., Rasmussen, R., Arnts, R. R., and Guenther, A.: A review and synthesis of monoterpene speciation from forests in the United States, Atmos. Environ., 34, 1761–1781, https://doi.org/10.1016/S1352-2310(99)00364-7, 2000.
Guenther, A. B., Jiang, X., Heald, C. L., Sakulyanontvittaya, T., Duhl, T., Emmons, L. K., and Wang, X.: The Model of Emissions of Gases and Aerosols from Nature version 2.1 (MEGAN2.1): an extended and updated framework for modeling biogenic emissions, Geosci. Model Dev., 5, 1471–1492, https://doi.org/10.5194/gmd-5-1471-2012, 2012.
Harland, P. W. and Vallance, C.: Ionization cross-sections and ionization efficiency curves from polarizability volumes and ionization potentials, Int. J. Mass Spectrom., 171, 173–181, https://doi.org/10.1016/S0168-1176(97)00137-7 1997.
He, J., Zou, Z., and Yang, X.: Measuring whole-body volatile organic compound emission by humans: A pilot study using an air-tight environmental chamber, Build. Environ., 153, 101–109, https://doi.org/10.1016/j.buildenv.2019.02.031, 2019.
Isaacman-Van Wertz, G., Sueper, D. T., Aikin, K. C., Lerner, B. M., Gilman, J. B., de Gouw, J. A., Worsnop, D. R., and Goldstein, A. H.: Automated single-ion peak fitting as an efficient approach for analyzing complex chromatographic data, J. Chromatogr. A, 1529, 81–92, https://doi.org/10.1016/j.chroma.2017.11.005, 2017.
Karakaş, F., Boylu, F., Karaağaçlıoğlu, I., and Çelik, M.: Minerals in paint industry: Talc utilization as an extender material and its effect on paint performance, XII International Mineral Processing Symposium, Cappadocia-Nevşehir, Turkey, 6–8 October 2010, 865–872, 2010.
Karakaş, F., Hassas, B. V., Özhan, K., Boylu, F., and Çelik, M. S.: Calcined kaolin and calcite as a pigment and substitute for TiO2 in water based paints, XIV Balkan Mineral Processing Congress, Tuzla, Bosnia, 2011, 461–464, 2011.
Kari, E., Miettinen, P., Yli-Pirilä, P., Virtanen, A., and Faiola, C. L.: PTR-ToF-MS product ion distributions and humidity-dependence of biogenic volatile organic compounds, Int. J. Mass Spectrom., 430, 87–97, https://doi.org/10.1016/j.ijms.2018.05.003, 2018.
Kim, S., Karl, T., Helmig, D., Daly, R., Rasmussen, R., and Guenther, A.: Measurement of atmospheric sesquiterpenes by proton transfer reaction-mass spectrometry (PTR-MS), Atmos. Meas. Tech., 2, 99–112, https://doi.org/10.5194/amt-2-99-2009, 2009.
Krechmer, J., Lopez-Hilfiker, F., Koss, A., Hutterli, M., Stoermer, C., Deming, B., Kimmel, J., Warneke, C., Holzinger, R., Jayne, J., Worsnop, D., Fuhrer, K., Gonin, M., and de Gouw, J.: Evaluation of a new reagent-ion source and focusing ion-molecule reactor for use in proton-transfer-reaction mass spectrometry, Anal. Chem., 90, 12011–12018, https://doi.org/10.1021/acs.analchem.8b02641, 2018.
Kristensen, K., Lunderberg, D. M., Liu, Y., Misztal, P. K., Tian, Y., Arata, C., Nazaroff, W. W., and Goldstein, A. H.: Sources and dynamics of semivolatile organic compounds in a single-family residence in northern California, Indoor Air, 29, 645–655, https://doi.org/10.1111/ina.12561, 2019.
Lee, A., Goldstein, A. H., Kroll, J. H., Ng, N. L., Varutbangkul, V., Flagan, R. C., and Seinfeld, J. H.: Gas-phase products and secondary aerosol yields from the photooxidation of 16 different terpenes, J. Geophys. Res.-Atmos., 111, D17305, https://doi.org/10.1029/2006jd007050, 2006.
Lehmann, R., Varaprath, S., and Frye, C.: Fate of silicone degradation products (silanols) in soil, Environ. Toxicol. Chem., 13, 1753–1759, https://doi.org/10.1002/etc.5620131106, 1994a.
Lehmann, R., Varaprath, S., and Frye, C.: Degradation of silicone polymers in soil, Environ. Toxicol. Chem., 13, 1061–1064, https://doi.org/10.1002/etc.5620130707, 1994b.
Lehmann, R., Varaprath, S., Annelin, R. B., and Arndt, J. L.: Degradation of silicone polymer in a variety of soils, Environ. Toxicol. Chem., 14, 1299–1305, https://doi.org/10.1002/etc.5620140806, 1995.
Lehmann, R., Miller, J., Xu, S., Singh, U., and Reece, C.: Degradation of silicone polymer at different soil moistures, Environ. Sci. Technol., 32, 1260–1264, https://doi.org/10.1021/es970918z, 1998.
Lei, Y. D., Wania, F., and Mathers, D.: Temperature-dependent vapor pressure of selected cyclic and linear polydimethylsiloxane oligomers, J. Chem. Eng. Data, 55, 5868–5873, https://doi.org/10.1021/je100835n, 2010.
Lerner, B. M., Gilman, J. B., Aikin, K. C., Atlas, E. L., Goldan, P. D., Graus, M., Hendershot, R., Isaacman-VanWertz, G. A., Koss, A., Kuster, W. C., Lueb, R. A., McLaughlin, R. J., Peischl, J., Sueper, D., Ryerson, T. B., Tokarek, T. W., Warneke, C., Yuan, B., and de Gouw, J. A.: An improved, automated whole air sampler and gas chromatography mass spectrometry analysis system for volatile organic compounds in the atmosphere, Atmos. Meas. Tech., 10, 291–313, https://doi.org/10.5194/amt-10-291-2017, 2017.
Linstrom, P. J. and Mallard, W. G.: NIST Chemistry WebBook, NIST Standard Reference Database Number 69, National Institute of Standards and Technology, Gaithersburg, MD, USA, available at: https://webbook.nist.gov/chemistry/, last access: 23 December 2020.
Liu, S., Li, R., Wild, R., Warneke, C., de Gouw, J., Brown, S., Miller, S., Luongo, J., Jimenez, J., and Ziemann, P.: Contribution of human-related sources to indoor volatile organic compounds in a university classroom, Indoor Air, 26, 925–938, https://doi.org/10.1111/ina.12272, 2016.
Liu, S., Thompson, S. L., Stark, H., Ziemann, P. J., and Jimenez, J. L.: Gas-phase carboxylic acids in a university classroom: Abundance, variability, and sources, Environ. Sci. Technol., 51, 5454–5463, https://doi.org/10.1021/acs.est.7b01358, 2017.
Liu, Y., Misztal, P. K., Xiong, J., Tian, Y., Arata, C., Weber, R. J., Nazaroff, W. W., and Goldstein, A. H.: Characterizing sources and emissions of volatile organic compounds in a northern California residence using space-and time-resolved measurements, Indoor Air, 29, 630–644, https://doi.org/10.1111/ina.12562, 2019.
Lunderberg, D. M., Kristensen, K., Liu, Y., Misztal, P. K., Tian, Y., Arata, C., Wernis, R., Kreisberg, N., Nazaroff, W. W., and Goldstein, A. H.: Characterizing airborne phthalate concentrations and dynamics in a normally occupied residence, Environ. Sci. Technol., 53, 7337–7346, https://doi.org/10.1021/acs.est.9b02123, 2019.
McDonald, B. C., Gentner, D. R., Goldstein, A. H., and Harley, R. A.: Long-term trends in motor vehicle emissions in US urban areas, Environ. Sci. Technol., 47, 10022–10031, https://doi.org/10.1021/es401034z, 2013.
McDonald, B. C., de Gouw, J. A., Gilman, J. B., Jathar, S. H., Akherati, A., Cappa, C. D., Jimenez, J. L., Lee-Taylor, J., Hayes, P. L., and McKeen, S. A.: Volatile chemical products emerging as largest petrochemical source of urban organic emissions, Science, 359, 760–764, https://doi.org/10.1126/science.aaq0524, 2018.
Obersteiner, F., Bönisch, H., and Engel, A.: An automated gas chromatography time-of-flight mass spectrometry instrument for the quantitative analysis of halocarbons in air, Atmos. Meas. Tech., 9, 179–194, https://doi.org/10.5194/amt-9-179-2016, 2016.
Pagonis, D., Price, D. J., Algrim, L. B., Day, D. A., Handschy, A. V., Stark, H., Miller, S. L., de Gouw, J., Jimenez, J. L., and Ziemann, P. J.: Time-resolved measurements of indoor chemical emissions, deposition, and reactions in a university art museum, Environ. Sci. Technol., 53, 4794–4802, https://doi.org/10.1021/acs.est.9b00276, 2019.
Price, D. J., Day, D. A., Pagonis, D., Stark, H., Algrim, L. B., Handschy, A. V., Liu, S., Krechmer, J. E., Miller, S. L., and Hunter, J. F.: Budgets of organic carbon composition and oxidation in indoor air, Environ. Sci. Technol., 53, 13053–13063, https://doi.org/10.1021/acs.est.9b04689, 2019.
Rizk, M., Guo, F., Verriele, M., Ward, M., Dusanter, S., Blond, N., Locoge, N., and Schoemaecker, C.: Impact of material emissions and sorption of volatile organic compounds on indoor air quality in a low energy building: Field measurements and modeling, Indoor air, 28, 924–935, https://doi.org/10.1111/ina.12493, 2018.
Rücker, C. and Kümmerer, K.: Environmental chemistry of organosiloxanes, Chem. Rev., 115, 466–524, https://doi.org/10.1021/cr500319v, 2015.
Sekimoto, K., Li, S.-M., Yuan, B., Koss, A., Coggon, M., Warneke, C., and de Gouw, J.: Calculation of the sensitivity of proton-transfer-reaction mass spectrometry (PTR-MS) for organic trace gases using molecular properties, Int. J. Mass Spectrom., 421, 71–94, https://doi.org/10.1016/j.ijms.2017.04.006, 2017.
Steeghs, M., Crespo, E., and Harren, F.: Collision induced dissociation study of 10 monoterpenes for identification in trace gas measurements using the newly developed proton-transfer reaction ion trap mass spectrometer, Int. J. Mass Spectrom., 263, 204–212, https://doi.org/10.1016/j.ijms.2007.02.011, 2007.
Sun, X., He, J., and Yang, X.: Human breath as a source of VOCs in the built environment, Part II: concentration levels, emission rates and factor analysis, Build. Environ., 123, 437–445, https://doi.org/10.1016/j.buildenv.2017.07.009, 2017.
Tang, X., Misztal, P. K., Nazaroff, W. W., and Goldstein, A. H.: Siloxanes are the most abundant volatile organic compound emitted from engineering students in a classroom, Environ. Sci. Tech. Let., 2, 303–307, https://doi.org/10.1021/acs.estlett.5b00256, 2015.
Tang, X., Misztal, P. K., Nazaroff, W. W., and Goldstein, A. H.: Volatile organic compound emissions from humans indoors, Environ. Sci. Technol., 50, 12686–12694, https://doi.org/10.1021/acs.est.6b04415, 2016.
Tanner, D., Helmig, D., Hueber, J., and Goldan, P.: Gas chromatography system for the automated, unattended, and cryogen-free monitoring of C2 to C6 non-methane hydrocarbons in the remote troposphere, J. Chromatogr. A, 1111, 76–88, https://doi.org/10.1016/j.chroma.2006.01.100, 2006.
Thompson, S. L., Yatavelli, R. L., Stark, H., Kimmel, J. R., Krechmer, J. E., Day, D. A., Hu, W., Isaacman-VanWertz, G., Yee, L., Goldstein, A. H., Khan, M. A. H., Holzinger, R., Kreisberg, N., Lopez-Hilfiker, F. D., Mohr, C., Thronton, J. A., Jayne, J. T., Canagaratna, M., Worsnop, D., and Jimenez, J. L.: Field intercomparison of the gas/particle partitioning of oxygenated organics during the Southern Oxidant and Aerosol Study (SOAS) in 2013, Aerosol Sci. Tech., 51, 30–56, https://doi.org/10.1080/02786826.2016.1254719, 2017.
Tuazon, E. C., Aschmann, S. M., and Atkinson, R.: Atmospheric degradation of volatile methyl-silicon compounds, Environ. Sci. Technol., 34, 1970–1976, https://doi.org/10.1021/es9910053, 2000.
Van den Dool, H. and Kratz, P. D.: A generalization of the retention index system including linear temperature programmed gas-liquid partition chromatography, J. Chromatogr. A, 11, 463–471, https://doi.org/10.1016/S0021-9673(01)80947-X, 1963.
Wang, Y.: How pierced PTFE/silicone septa affect GC-MS experiments, Am. Lab., 38, 10–12, 2006.
Warneke, C., De Gouw, J. A., Kuster, W. C., Goldan, P. D., and Fall, R.: Validation of atmospheric VOC measurements by proton-transfer-reaction mass spectrometry using a gas-chromatographic preseparation method, Environ. Sci. Technol., 37, 2494–2501, https://doi.org/10.1021/es026266i, 2003.
Warneke, C., De Gouw, J. A., Holloway, J. S., Peischl, J., Ryerson, T. B., Atlas, E., Blake, D., Trainer, M., and Parrish, D. D.: Multiyear trends in volatile organic compounds in Los Angeles, California: Five decades of decreasing emissions, J. Geophys. Res.-Atmos., 117, D00V17, https://doi.org/10.1029/2012JD017899, 2012.
Watson, J. G., Chow, J. C., and Fujita, E. M.: Review of volatile organic compound source apportionment by chemical mass balance, Atmos. Environ., 35, 1567–1584, https://doi.org/10.1016/S1352-2310(00)00461-1, 2001.
Weschler, C. J. and Shields, H. C.: Potential reactions among indoor pollutants, Atmos. Environ., 31, 3487–3495, https://doi.org/10.1016/S1352-2310(97)00219-7, 1997.
Williams, J., Stönner, C., Wicker, J., Krauter, N., Derstroff, B., Bourtsoukidis, E., Klüpfel, T., and Kramer, S.: Cinema audiences reproducibly vary the chemical composition of air during films, by broadcasting scene specific emissions on breath, Sci. Rep.-UK, 6, 25464, https://doi.org/10.1038/srep25464, 2016.
Wolkoff, P.: Indoor air pollutants in office environments: assessment of comfort, health, and performance, Int. J. Hyg. Envir. Heal., 216, 371–394, https://doi.org/10.1016/j.ijheh.2012.08.001, 2013.
Wong, J., Carslaw, N., Zhao, R., Zhou, S., and Abbatt, J.: Observations and impacts of bleach washing on indoor chlorine chemistry, Indoor Air, 27, 1082–1090, https://doi.org/10.1111/ina.12402, 2017.
Xu, S., Lehmann, R. G., Miller, J. R., and Chandra, G.: Degradation of polydimethylsiloxanes (silicones) as influenced by clay minerals, Environ. Sci. Technol., 32, 1199–1206, https://doi.org/10.1021/es9708676, 1998.
Young, C. J., Zhou, S., Siegel, J. A., and Kahan, T. F.: Illuminating the dark side of indoor oxidants, Environ. Sci. Process. Impacts, 21, 1229–1239, https://doi.org/10.1039/C9EM00111E, 2019.
Yuan, B., Koss, A. R., Warneke, C., Coggon, M., Sekimoto, K., and de Gouw, J. A.: Proton-transfer-reaction mass spectrometry: applications in atmospheric sciences, Chem. Rev., 117, 13187–13229, https://doi.org/10.1021/acs.chemrev.7b00325, 2017.