Article's Content
Article's Content
Opening up a Google Analytics dashboard is like opening Pandora’s Box. There are many tables, charts, graphs, and data points that, deciding which metrics to measure can be overwhelming.
If you try to measure everything available, you’ll end up measuring nothing at all. And by measuring nothing at all, you’re measuring nothing at all, just throwing darts at a board.
So, what metrics should you be measuring?
Above all, make sure you track metrics related to your marketing strategy goals and the company’s overall business goals. They may not be the top three mentioned here, and that’s okay. Vanity metrics (page views, traffic, social likes, etc.) may not be fantastic, but they can offer great insights into user behaviour. Just don’t focus on vanity metrics alone.
What Are Content Analytics?
Content analytics refers to using measured metrics to rate and judge your content and content marketing efforts’ effectiveness. Content analytics are used to identify areas of strength and weakness within your current content marketing efforts. Findings from content analytics highlight areas that require change and act as a map for doing so.
Using Foundation’s case study on The Canva Backlink Empire: How SEO, Outreach & Content Led To A $6B Valuation as an example, we track a number of metrics…
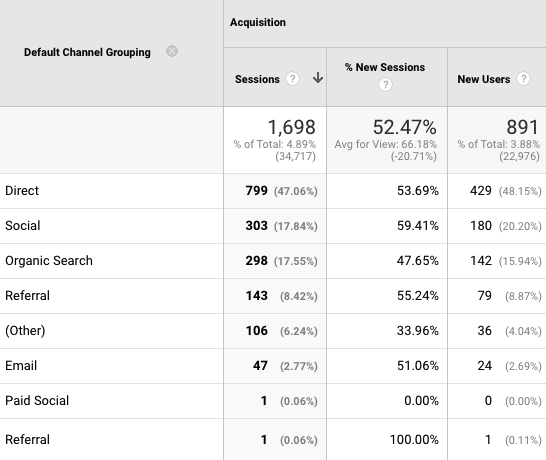
General traffic sources:
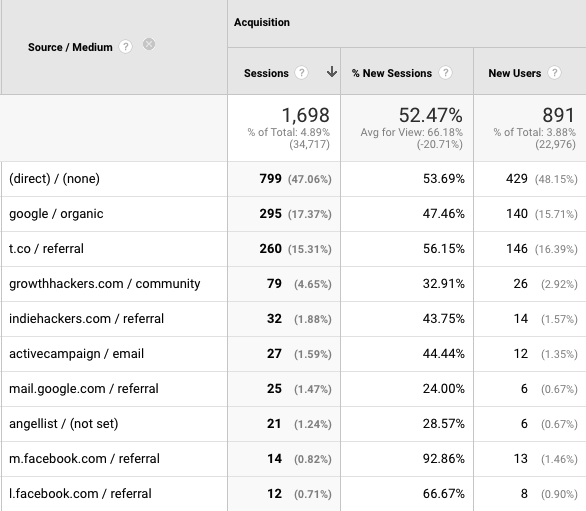
Specific traffic sources:
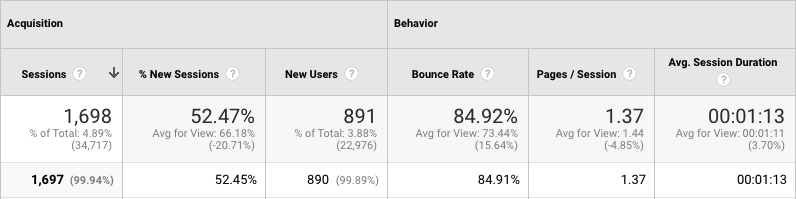
And overall session behaviours:
Analytics data is from January 2021; the Canva Case Study was published in June 2020.
The Importance of Tracking Analytics
Think of metrics as silent customer feedback. They are the internet’s way of telling you where the errors are and where prospective customers are falling out of your sales funnel.
They help you understand which content assets are your top performers in terms of traffic, engagement, and conversions. Uncovering that information provides you with insights on what pages to prioritize and model future content on—if it works, how do you repeat that success?
Measuring metrics highlights and tracks areas for optimization on pages that aren’t top performers. It allows you to identify which growth levers you can pull and follow the same metrics over time to track success rates.
- If conversions are high and on the rise, optimize for more traffic.
- If your page is about time zones and includes a widget for checking the time in other countries, focus on session engagement over session time. Visitors are there to use the widget, not read the content.
Remember—all metrics must be put into context with the page goal, site goal, and business goals developed from your content marketing strategy.
With all that said, let’s hop into the first metric to measure.
1. Sessions (By Traffic Source)
How can you sleep at night wondering about your content, all alone on the world wide web with no one coming to click on it?
Restless nights worrying about your content will be a thing of the past once you begin tracking sessions and breaking down traffic by source.
What is a session?
A session measures the period of time in which a user is engaged with your website. It is tracked through screen views, click-throughs, and other engagement metrics.
Tracking sessions is critical to identifying what content performs best. When session lengths are put into context, they can uncover:
- Which pages spur the most significant site interest (using pages/session)
- Which pages are not delivering value to your audience (through session exit pages)
- Which pages are matching search intent and which aren’t (based on direct traffic session length)
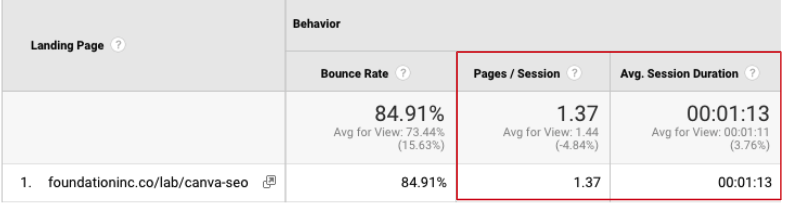
Our Canva SEO case study has demonstrated that visitors to this page aren’t spending as much time as we’d like them to reading this or continuing to different pages on our site.
As you will see, this page’s top channel is direct traffic. When put into context, we can say that although session duration is low, the number of returning visits indicates that users view this piece in chunks and leverage it as a resource.
Tha insight helps us see that we could have success offering a downloadable PDF version, above the fold, behind a gated wall to allow readers to take the information offline as a handy reference while creating leads.
Acquired Sessions by Traffic Source
It is essential to know how many people are seeing your content. That information allows you to set achievable goals for page views and conversion rates and helps you identify best practices from high-performing pages.
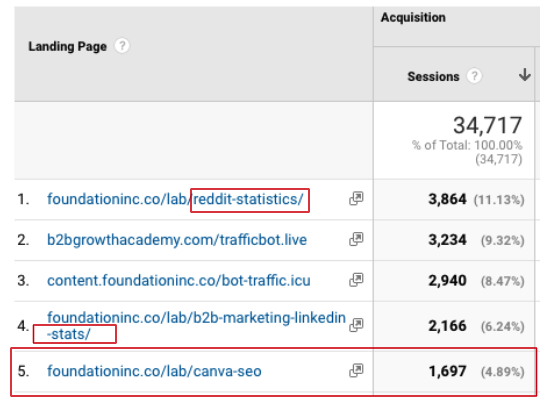
Above is a screengrab from Foundation’s Google Analytics total sessions by landing page. As you can see from the chart, two of the five top-performing blogs by session share statistics relevant to our audience. This tells us that it’s necessary to keep these pages updated and, when possible, create more content around relevant stat breakdowns.
The other landing page worth focusing on is our Canva SEO case study. It has taken off amongst our audience as a killer thought leadership piece. Though it was originally published over six months ago, people are still coming back to it and sharing it with others. It’s still gaining traction on Twitter and acquiring new sessions.
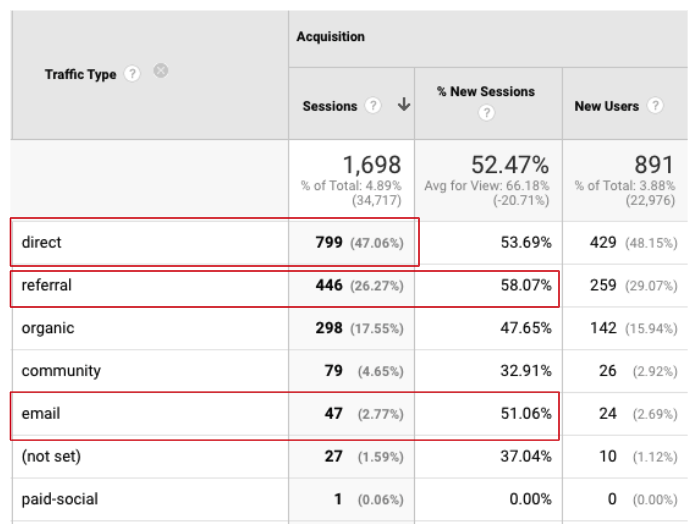
By tracking the link, we can drill down to traffic type and see that people are returning time and time again directly through the link. People are sharing the link with friends who are plugging it right into their URL bar.
Right off the bat, this is a sign that this content is being used as a resource. Looking at the referral traffic, our second-highest channel, we can see that other sites find this piece of content valuable as well.
This piece is being linked online and is gaining high levels of interaction from users—58% of the sessions are new, meaning these visitors have never seen this piece of content before. We are gaining repeat visits, but we are also continuing to attract new visitors to our site.
Calling attention to the email field, 51% of sessions are new. This channel has helped to increase our audience, gain new views on our page, and ideally result in further site interaction and conversion.
If you want to take it a step further—we highly recommend you do—measure traffic by source.
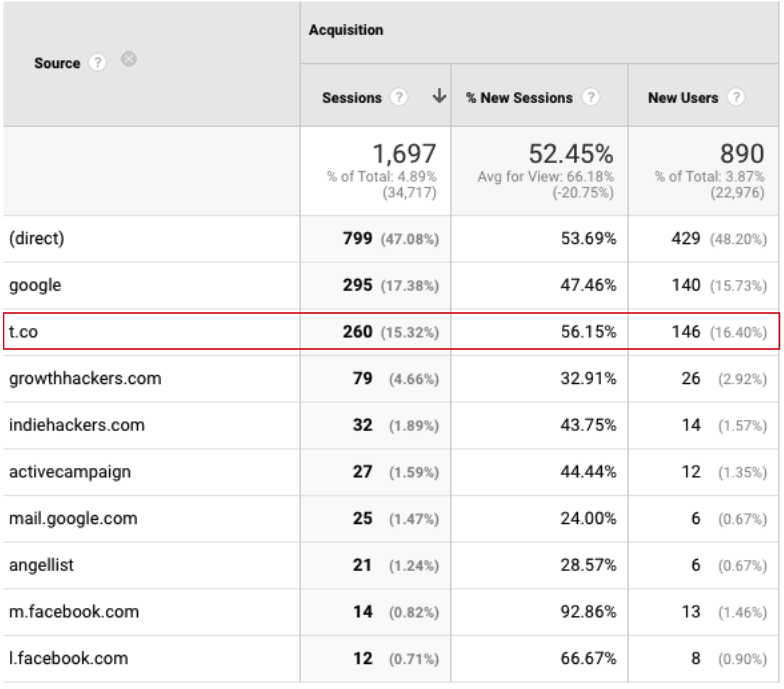
For us, our top source channel is Twitter. Sharing Twitter content outperforms Facebook and LinkedIn for owned social channels and beats out backlinks from community forums. For all content, new and existing, Twitter distribution is best since we have quantified that channel’s success.
Measuring sessions and channel performance is key to identifying high-performing content giving you insights into pieces that should be reverse engineered and top channels for distribution.
Bonus Tip: Sessions are a great way to identify seasonal content on your site, as the page popularity rises and falls throughout the year.
2. Conversion Rates
As much we’d like them to, sessions and pageviews won’t pay the bills on their own. You need to be tracking how well your content is converting visitors into leads or customers.
Conversions can include downloading a resource, requesting a demo, starting a free trial, buying a product, signing up for a newsletter, etc. The conversion rate is calculated by taking the number of conversions occurring on a page, dividing it by the number of page sessions, and multiplying by 100 to get a percent.
We track these rates and measure conversions per page to identify best practices, top-converting pages, and top converting content.
Not all landing pages have the goal of conversions, making it a non-priority metric to measure. However, conversions that occur elsewhere on your site can be attributed to landing pages, where visitors start their journey.
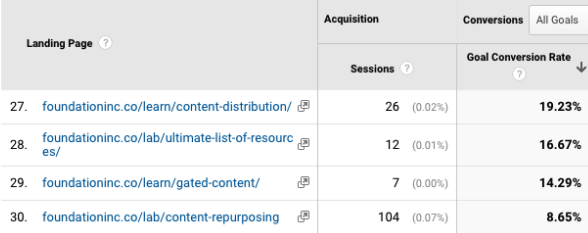
Four of our top converting landing pages are listed above. Even if the conversion didn’t happen on one of these pages directly, the user started their journey there.
The best way to understand what conversions are occurring is to set up custom goals within Google Analytics. This way, you can break down specific conversions and track each asset’s success or CTA individually.
Conversion rates guide future collateral creation and monetization of current resources as it tells you what content is excelling and at what price point it succeeds. If you have an ebook or presentation available for a free download and the conversion rate is 15%, you should monetize it!
The average conversion rate for business services pages is 3%, according to The Unbounce Conversion Benchmark Report – 2020, with top-performing industry sites converting at 22%.
You should be aware that free resources will have higher conversion rates than paid resources. When you have lower session numbers, this metric may be skewed by the small dataset.
3. Bounce Rates
This final metric to measure for content analytics is bounce rates.
Bounce rates indicate how many users bounce off your site after entering. Essentially, they tell you how many people left after entering your site without taking any further action.
A lower bounce rate is what you should be aiming for. It tells you users are interested in your content and are engaging with your site. A high bounce rate is a warning sign of poor site navigation or weak CTAs.
Look at your pages with low bounce rates and identify the unique features that encourage visitors to click through to a different page or engage with a CTA. Use those findings to optimize high bounce rate pages for increased session time, more engagement, and higher conversion rates.

Unbounce has a fantastic user experience and clear navigation, including two free trial CTAs right above the fold with a sticky nav bar that allows easy access through the site menu.
Bounce Rates Require Context
When measuring this metric, it is crucial to keep it in context. Bounce rates need to be interpreted; a blog post with high traffic and appropriate session times is a high-performance blog post. Blog posts don’t require engagement, and many times visitors get what they need from that one page without needing to go elsewhere on site, so a high bounce rate is perfectly acceptable.
However, when your homepage has a high bounce rate, that is cause for concern. Seeing high amounts of organic traffic coming into your homepage with a correlating high bounce rate means that the homepage is not optimized for the right search query, has confusing or broken navigation, or lacks strong calls to action.
Bounce rates can be tied to devices as well. You may notice that mobile users have a higher bounce rate than desktop users. This would indicate an issue on your mobile site that requires investigation.
Social Media Metrics to Measure
As a bonus metric to measure, I want to talk a little about social media vanity metrics.
These metrics—likes, shares, and comments—aren’t success metrics on their own. Value is added when used to compare one social post to another.
For example, if tweets are written in thread form or include images…
Friendly reminder. pic.twitter.com/Khyhef0OEc
— Ross Simmonds (@TheCoolestCool) February 19, 2021
….are consistently outperforming plain copy tweets…
Before writing that blog post know:
– The goal of the blog post
– Who you’re trying to reach
– Why you should write this post
– What content it will compete with
– Where it fits in the buyers journey
– Where it will be distributed and shared— Ross Simmonds (@TheCoolestCool) February 19, 2021
you have gained an insightful perspective. You now know to lean on media, optimized thumbnail images, threads, videos, emojis, etc., because of that vanity metric.
If something is getting more love on social media, that is a sign to look into it, identify its key differentiators, and apply them to future strategies.
TL;DR
You need to measure metrics, track changes, and rely on content analytics to make strategic decisions in optimizing existing content. Tracking everything won’t do you any good. Your efforts need to be specific and ideally tied to marketing and/or business goals.
When measuring and tracking metrics, make sure to do so in context—data doesn’t provide the whole story and different pages have different goals.
To recap, here are the three main metrics to measure when tracking content analytics:
- Sessions (by traffic source)
- Keep an eye on the time spent on a page, what pages are bringing in the most sessions, and the channels that work best for acquisition.
- Completing this analysis will help identify top-performing pages and valuable distribution channels to focus on.
- Conversion rates
- The main goal in publishing content online is to earn conversions, be they leads or resource downloads. Tracking the top conversion pages provides you with a guide to reverse engineer to optimize existing and future conversion-focused pages.
- Not every page needs to be a conversion page. Remember the goal of the page before splitting hairs over a conversion rate.
- Bounce rates
- Bounce rates can be used to identify optimizations required for site navigation and a successful call to action.
- Aim for high conversion rates and low bounce rates. We want users to stick on your site, visit another page, and take action.
- High bounce rates can be a cause for concern. Homepages should have the lowest bounce as users navigate throughout the site and engage with calls to action. If bounce rates are high, it is cause for investigation.
Overall metrics are great, but they need to be understood and contextualized to deliver the most value. As important as these metrics are, measuring them with no strategy or goals in place limits their value.